29
/fr/
fr
AIzaSyAYiBZKx7MnpbEhh9jyipgxe19OcubqV5w
April 1, 2024
193385
Mauritania
MRT
true
2
1
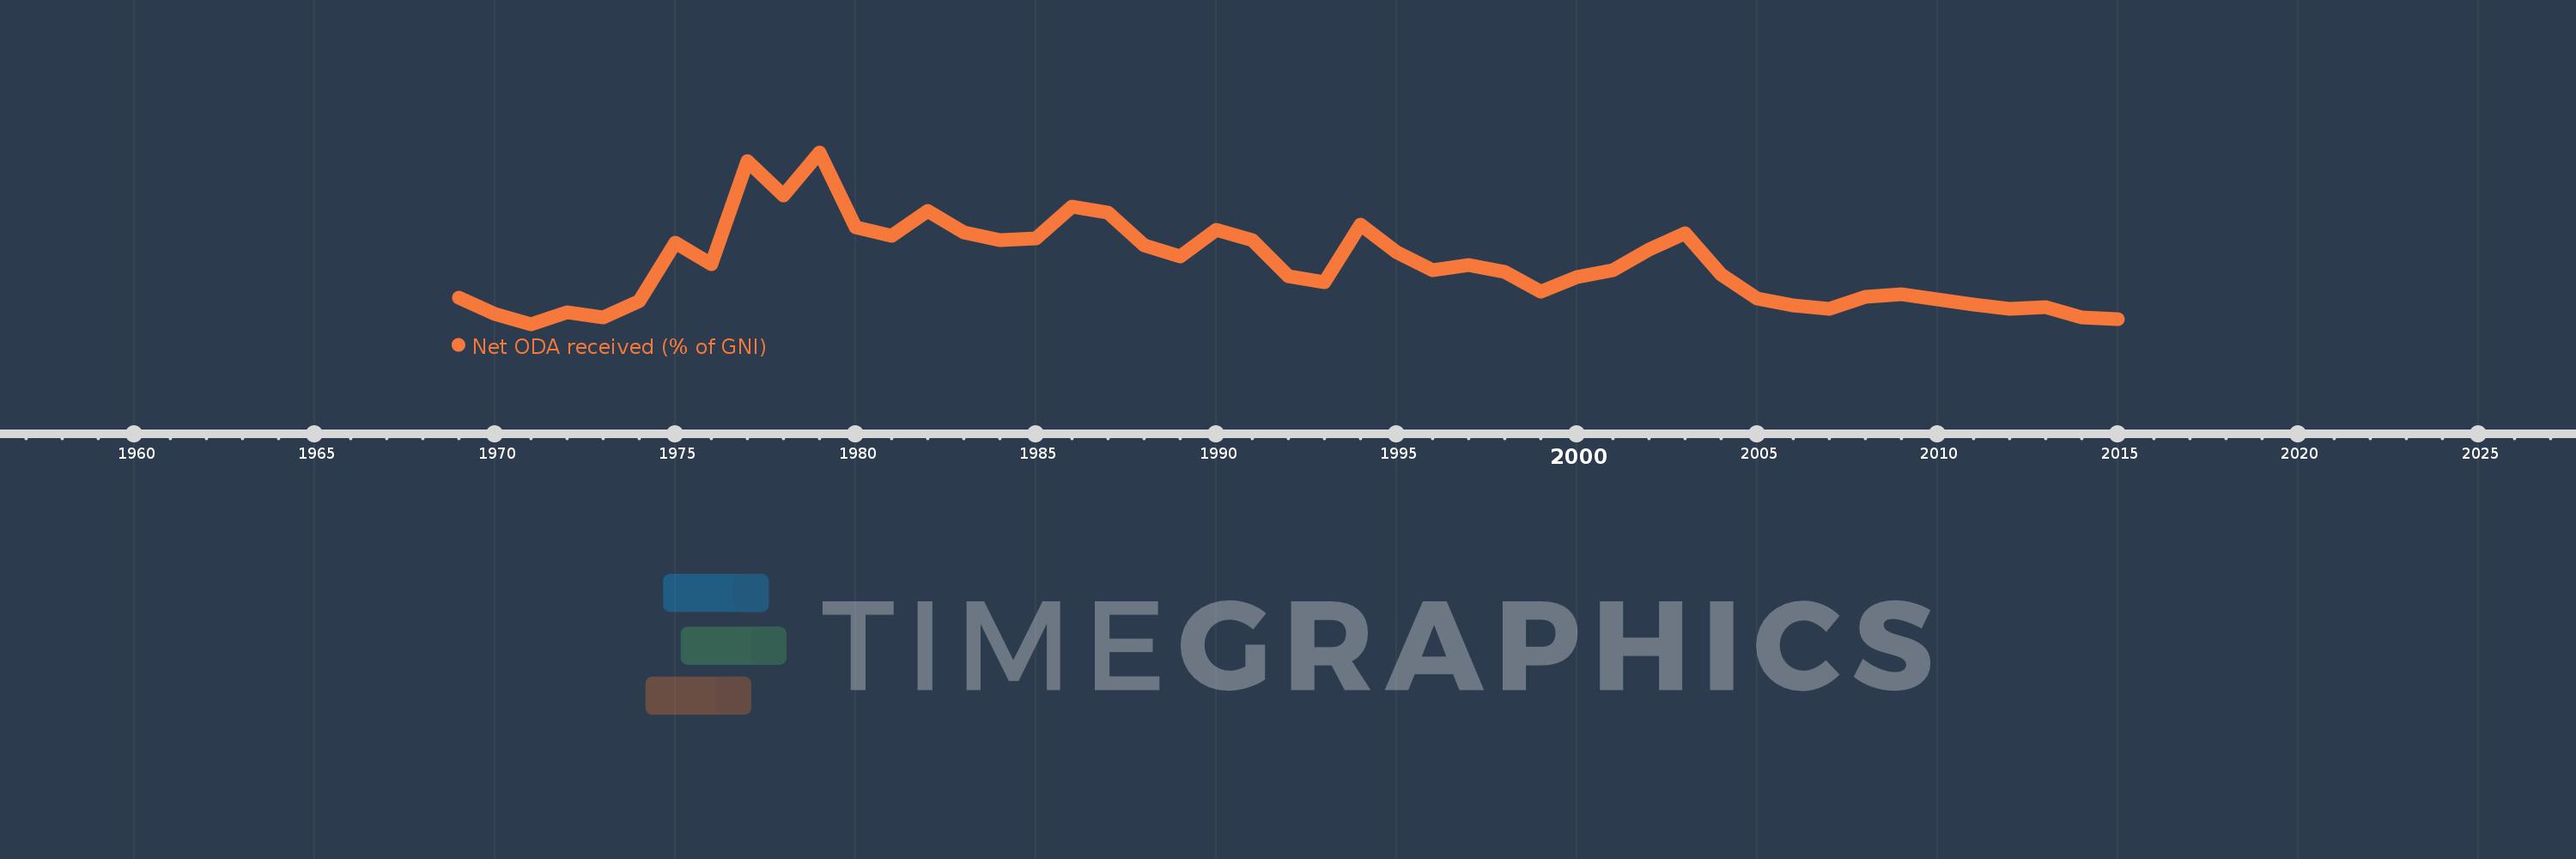
Net ODA received (% of GNI)
2015,2014,2013,2012,2011,2010,2009,2008,2007,2006,2005,2004,2003,2002,2001,2000,1999,1998,1997,1996,1995,1994,1993,1992,1991,1990,1989,1988,1987,1986,1985,1984,1983,1982,1981,1980,1979,1978,1977,1976,1975,1974,1973,1972,1971,1970,1969
Cette statistique dans les autres pays:
AfghanistanAlbaniaAlgeriaAngolaAntigua and BarbudaArab WorldArgentinaArmeniaAzerbaijanBahamas, TheBahrainBangladeshBarbadosBelarusBelizeBeninBermudaBhutanBoliviaBosnia and HerzegovinaBotswanaBrazilBrunei DarussalamBurkina FasoBurundiCabo VerdeCambodiaCameroonCaribbean small statesCentral African RepublicCentral Europe and the BalticsChadChileChinaColombiaComorosCongo, Dem. Rep.Congo, Rep.Costa RicaCote d'IvoireCroatiaCubaCyprusDjiboutiDominicaDominican RepublicEast Asia & PacificEast Asia & Pacific (excluding high income)East Asia & Pacific (IDA & IBRD countries)EcuadorEgypt, Arab Rep.El SalvadorEquatorial GuineaEritreaEthiopiaEuro areaEurope & Central AsiaEurope & Central Asia (excluding high income)Europe & Central Asia (IDA & IBRD countries)European UnionFijiFragile and conflict affected situationsFrench PolynesiaGabonGambia, TheGeorgiaGhanaGrenadaGuatemalaGuineaGuinea-BissauGuyanaHaitiHeavily indebted poor countries (HIPC)High incomeHondurasHong Kong SAR, ChinaIBRD onlyIDA & IBRD totalIDA blendIDA onlyIDA totalIndiaIndonesiaIran, Islamic Rep.IraqIsraelJamaicaJordanKazakhstanKenyaKiribatiKorea, Rep.KosovoKuwaitKyrgyz RepublicLao PDRLatin America & Caribbean Latin America & Caribbean (excluding high income)Latin America & the Caribbean (IDA & IBRD countries)Least developed countries: UN classificationLebanonLesothoLiberiaLibyaLow & middle incomeLow incomeLower middle incomeMacao SAR, ChinaMacedonia, FYRMadagascarMalawiMalaysiaMaldivesMaliMaltaMarshall IslandsMauritaniaMauritiusMexicoMicronesia, Fed. Sts.Middle East & North AfricaMiddle East & North Africa (excluding high income)Middle East & North Africa (IDA & IBRD countries)Middle incomeMoldovaMongoliaMontenegroMoroccoMozambiqueMyanmarNamibiaNauruNepalNew CaledoniaNicaraguaNigerNigeriaNorth AmericaOECD membersOmanOther small statesPacific island small statesPakistanPalauPanamaPapua New GuineaParaguayPeruPhilippinesQatarRwandaSamoaSao Tome and PrincipeSaudi ArabiaSenegalSerbiaSeychellesSierra LeoneSingaporeSloveniaSmall statesSolomon IslandsSomaliaSouth AfricaSouth AsiaSouth Asia (IDA & IBRD)South SudanSri LankaSt. Kitts and NevisSt. LuciaSt. Vincent and the GrenadinesSub-Saharan Africa Sub-Saharan Africa (excluding high income)Sub-Saharan Africa (IDA & IBRD countries)SudanSurinameSwazilandSyrian Arab RepublicTajikistanTanzaniaThailandTimor-LesteTogoTongaTrinidad and TobagoTunisiaTurkeyTurkmenistanTuvaluUgandaUkraineUpper middle incomeUruguayUzbekistanVanuatuVenezuela, RBVietnamWest Bank and GazaWorldYemen, Rep.ZambiaZimbabwe La ligne de temps
Cette échelle de temps montre un graphique de 1969 année à 2015 année Mauritania. Les données jusqu'à 1968 année ne sont pas présentés. Quantité d'observations actuelles selon dates: 47.
Source (désignation):
Les indicateurs du développement mondiale
Source (organisation):
Development Assistance Committee of the Organisation for Economic Co-operation and Development, Geographical Distribution of Financial Flows to Developing Countries, Development Co-operation Report, and International Development Statistics database. Data are available online at: www.oecd.org/dac/stats/idsonline. World Bank GNI estimates are used for the denominator.
Catégories:
Aid Effectiveness, Economy & Growth, External Debt
Dernière mise à jour
23 avr. 2017
Les indicateurs de changement de valeurs selon les années
Minimum:
3.792
1 janv. 1971
Maximum:
46.408
1 janv. 1979
Pour la date d''observation
Valeur
Changement absolu
Le changement par rapport à la valeur précédente
1 janv. 1969
10.459
+10.459
0.0%
1 janv. 1970
6.408
-4.05
-38.73%
1 janv. 1971
3.792
-2.616
-40.83%
1 janv. 1972
6.851
+3.059
80.67%
1 janv. 1973
5.372
-1.479
-21.59%
1 janv. 1974
9.539
+4.167
77.57%
1 janv. 1975
23.935
+14.396
150.91%
1 janv. 1976
18.657
-5.277
-22.05%
1 janv. 1977
44.262
+25.605
137.24%
1 janv. 1978
35.781
-8.482
-19.16%
1 janv. 1979
46.408
+10.627
29.7%
1 janv. 1980
27.775
-18.633
-40.15%
1 janv. 1981
25.707
-2.068
-7.45%
1 janv. 1982
31.992
+6.285
24.45%
1 janv. 1983
26.636
-5.356
-16.74%
1 janv. 1984
24.73
-1.906
-7.16%
1 janv. 1985
25.117
+0.387
1.56%
1 janv. 1986
32.904
+7.788
31.01%
1 janv. 1987
31.475
-1.429
-4.34%
1 janv. 1988
23.303
-8.171
-25.96%
1 janv. 1989
20.659
-2.645
-11.35%
1 janv. 1990
27.227
+6.568
31.79%
1 janv. 1991
24.587
-2.64
-9.7%
1 janv. 1992
15.726
-8.862
-36.04%
1 janv. 1993
14.281
-1.445
-9.19%
1 janv. 1994
28.566
+14.285
100.03%
1 janv. 1995
21.635
-6.931
-24.26%
1 janv. 1996
17.139
-4.496
-20.78%
1 janv. 1997
18.535
+1.396
8.15%
1 janv. 1998
16.816
-1.719
-9.28%
1 janv. 1999
11.82
-4.996
-29.71%
1 janv. 2000
15.498
+3.678
31.11%
1 janv. 2001
17.091
+1.593
10.28%
1 janv. 2002
22.389
+5.297
30.99%
1 janv. 2003
26.349
+3.96
17.69%
1 janv. 2004
16.082
-10.267
-38.96%
1 janv. 2005
10.244
-5.839
-36.31%
1 janv. 2006
8.39
-1.853
-18.09%
1 janv. 2007
7.605
-0.785
-9.35%
1 janv. 2008
10.535
+2.93
38.52%
1 janv. 2009
11.28
+0.745
7.08%
1 janv. 2010
10.055
-1.225
-10.86%
1 janv. 2011
8.678
-1.377
-13.69%
1 janv. 2012
7.597
-1.081
-12.45%
1 janv. 2013
8.097
+0.499
6.57%
1 janv. 2014
5.392
-2.705
-33.41%
1 janv. 2015
4.955
-0.437
-8.1%
Classement des pays selon les statistiques actuelles par années


Commentaires: