29
/fr/
fr
AIzaSyAYiBZKx7MnpbEhh9jyipgxe19OcubqV5w
April 1, 2024
61919
Upper middle income
UMC
false
2
1
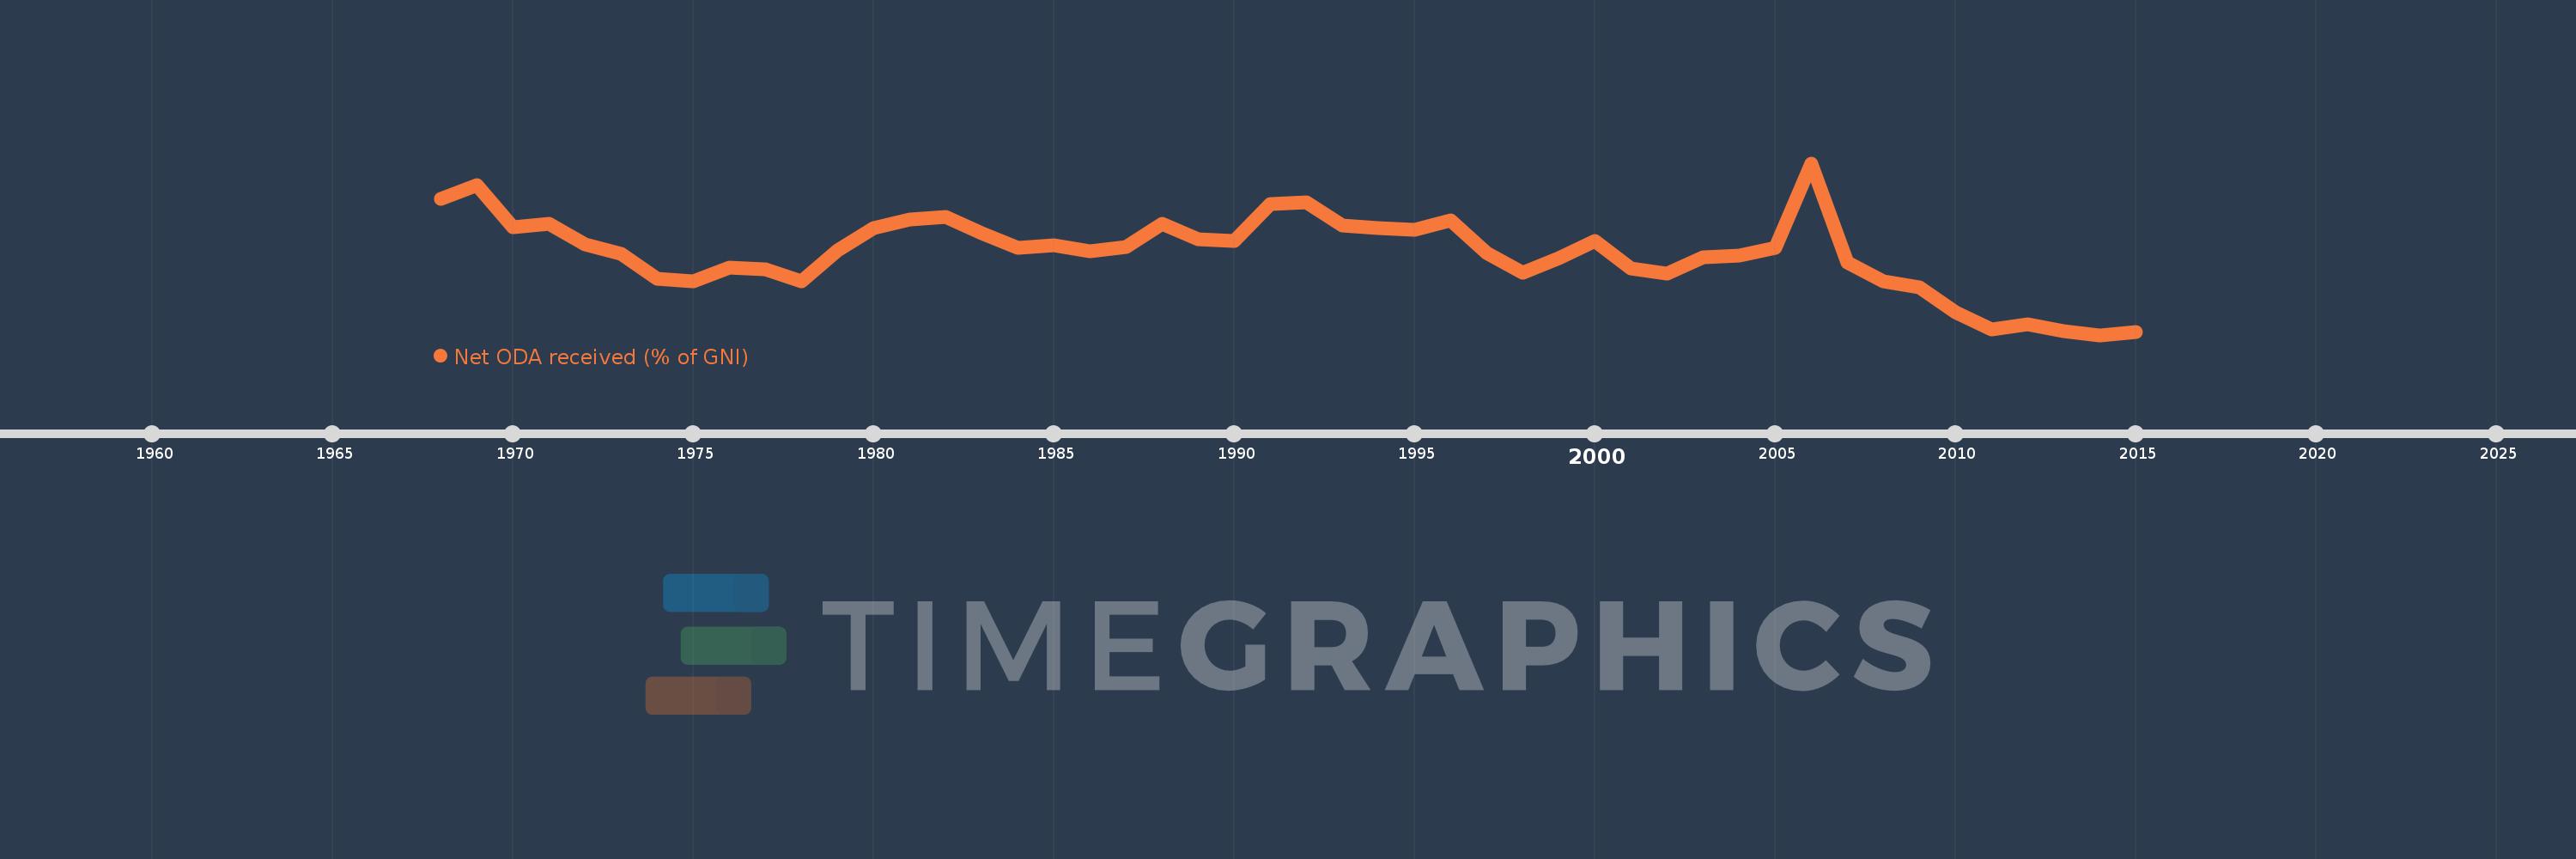
Net ODA received (% of GNI)
2015,2014,2013,2012,2011,2010,2009,2008,2007,2006,2005,2004,2003,2002,2001,2000,1999,1998,1997,1996,1995,1994,1993,1992,1991,1990,1989,1988,1987,1986,1985,1984,1983,1982,1981,1980,1979,1978,1977,1976,1975,1974,1973,1972,1971,1970,1969,1968
Cette statistique dans les autres pays:
AfghanistanAlbaniaAlgeriaAngolaAntigua and BarbudaArab WorldArgentinaArmeniaAzerbaijanBahamas, TheBahrainBangladeshBarbadosBelarusBelizeBeninBermudaBhutanBoliviaBosnia and HerzegovinaBotswanaBrazilBrunei DarussalamBurkina FasoBurundiCabo VerdeCambodiaCameroonCaribbean small statesCentral African RepublicCentral Europe and the BalticsChadChileChinaColombiaComorosCongo, Dem. Rep.Congo, Rep.Costa RicaCote d'IvoireCroatiaCubaCyprusDjiboutiDominicaDominican RepublicEast Asia & PacificEast Asia & Pacific (excluding high income)East Asia & Pacific (IDA & IBRD countries)EcuadorEgypt, Arab Rep.El SalvadorEquatorial GuineaEritreaEthiopiaEuro areaEurope & Central AsiaEurope & Central Asia (excluding high income)Europe & Central Asia (IDA & IBRD countries)European UnionFijiFragile and conflict affected situationsFrench PolynesiaGabonGambia, TheGeorgiaGhanaGrenadaGuatemalaGuineaGuinea-BissauGuyanaHaitiHeavily indebted poor countries (HIPC)High incomeHondurasHong Kong SAR, ChinaIBRD onlyIDA & IBRD totalIDA blendIDA onlyIDA totalIndiaIndonesiaIran, Islamic Rep.IraqIsraelJamaicaJordanKazakhstanKenyaKiribatiKorea, Rep.KosovoKuwaitKyrgyz RepublicLao PDRLatin America & Caribbean Latin America & Caribbean (excluding high income)Latin America & the Caribbean (IDA & IBRD countries)Least developed countries: UN classificationLebanonLesothoLiberiaLibyaLow & middle incomeLow incomeLower middle incomeMacao SAR, ChinaMacedonia, FYRMadagascarMalawiMalaysiaMaldivesMaliMaltaMarshall IslandsMauritaniaMauritiusMexicoMicronesia, Fed. Sts.Middle East & North AfricaMiddle East & North Africa (excluding high income)Middle East & North Africa (IDA & IBRD countries)Middle incomeMoldovaMongoliaMontenegroMoroccoMozambiqueMyanmarNamibiaNauruNepalNew CaledoniaNicaraguaNigerNigeriaNorth AmericaOECD membersOmanOther small statesPacific island small statesPakistanPalauPanamaPapua New GuineaParaguayPeruPhilippinesQatarRwandaSamoaSao Tome and PrincipeSaudi ArabiaSenegalSerbiaSeychellesSierra LeoneSingaporeSloveniaSmall statesSolomon IslandsSomaliaSouth AfricaSouth AsiaSouth Asia (IDA & IBRD)South SudanSri LankaSt. Kitts and NevisSt. LuciaSt. Vincent and the GrenadinesSub-Saharan Africa Sub-Saharan Africa (excluding high income)Sub-Saharan Africa (IDA & IBRD countries)SudanSurinameSwazilandSyrian Arab RepublicTajikistanTanzaniaThailandTimor-LesteTogoTongaTrinidad and TobagoTunisiaTurkeyTurkmenistanTuvaluUgandaUkraineUpper middle incomeUruguayUzbekistanVanuatuVenezuela, RBVietnamWest Bank and GazaWorldYemen, Rep.ZambiaZimbabwe La ligne de temps
Cette échelle de temps montre un graphique de 1968 année à 2015 année Upper middle income. Les données jusqu'à 1967 année ne sont pas présentés. Quantité d'observations actuelles selon dates: 48.
Source (désignation):
Les indicateurs du développement mondiale
Source (organisation):
Development Assistance Committee of the Organisation for Economic Co-operation and Development, Geographical Distribution of Financial Flows to Developing Countries, Development Co-operation Report, and International Development Statistics database. Data are available online at: www.oecd.org/dac/stats/idsonline. World Bank GNI estimates are used for the denominator.
Catégories:
Aid Effectiveness, Economy & Growth, External Debt
Dernière mise à jour
23 avr. 2017
Les indicateurs de changement de valeurs selon les années
Minimum:
0.071
1 janv. 2014
Maximum:
0.443
1 janv. 2006
Pour la date d''observation
Valeur
Changement absolu
Le changement par rapport à la valeur précédente
1 janv. 1968
0.366
+0.366
0.0%
1 janv. 1969
0.396
+0.03
8.06%
1 janv. 1970
0.305
-0.09
-22.85%
1 janv. 1971
0.311
+0.006
1.81%
1 janv. 1972
0.268
-0.043
-13.67%
1 janv. 1973
0.247
-0.021
-7.78%
1 janv. 1974
0.192
-0.056
-22.48%
1 janv. 1975
0.188
-0.004
-1.93%
1 janv. 1976
0.217
+0.029
15.27%
1 janv. 1977
0.213
-0.004
-2.01%
1 janv. 1978
0.187
-0.026
-12.08%
1 janv. 1979
0.254
+0.067
36.02%
1 janv. 1980
0.303
+0.049
19.11%
1 janv. 1981
0.322
+0.019
6.31%
1 janv. 1982
0.327
+0.005
1.52%
1 janv. 1983
0.292
-0.034
-10.52%
1 janv. 1984
0.259
-0.034
-11.53%
1 janv. 1985
0.265
+0.007
2.53%
1 janv. 1986
0.253
-0.012
-4.54%
1 janv. 1987
0.262
+0.008
3.31%
1 janv. 1988
0.312
+0.051
19.33%
1 janv. 1989
0.279
-0.033
-10.54%
1 janv. 1990
0.274
-0.005
-1.7%
1 janv. 1991
0.355
+0.081
29.35%
1 janv. 1992
0.358
+0.003
0.79%
1 janv. 1993
0.309
-0.049
-13.66%
1 janv. 1994
0.303
-0.006
-1.91%
1 janv. 1995
0.298
-0.005
-1.78%
1 janv. 1996
0.319
+0.022
7.33%
1 janv. 1997
0.248
-0.071
-22.38%
1 janv. 1998
0.205
-0.043
-17.4%
1 janv. 1999
0.237
+0.032
15.49%
1 janv. 2000
0.275
+0.038
16.23%
1 janv. 2001
0.215
-0.06
-21.87%
1 janv. 2002
0.204
-0.01
-4.83%
1 janv. 2003
0.239
+0.035
16.89%
1 janv. 2004
0.243
+0.004
1.81%
1 janv. 2005
0.259
+0.015
6.33%
1 janv. 2006
0.443
+0.185
71.44%
1 janv. 2007
0.229
-0.215
-48.45%
1 janv. 2008
0.187
-0.041
-18.1%
1 janv. 2009
0.175
-0.012
-6.32%
1 janv. 2010
0.121
-0.054
-30.73%
1 janv. 2011
0.084
-0.038
-31.03%
1 janv. 2012
0.095
+0.011
13.38%
1 janv. 2013
0.079
-0.016
-16.91%
1 janv. 2014
0.071
-0.008
-10.11%
1 janv. 2015
0.077
+0.006
8.37%
Classement des pays selon les statistiques actuelles par années


Commentaires: