29
/fr/
fr
AIzaSyAYiBZKx7MnpbEhh9jyipgxe19OcubqV5w
April 1, 2024
63778
Afghanistan
AFG
true
2
1
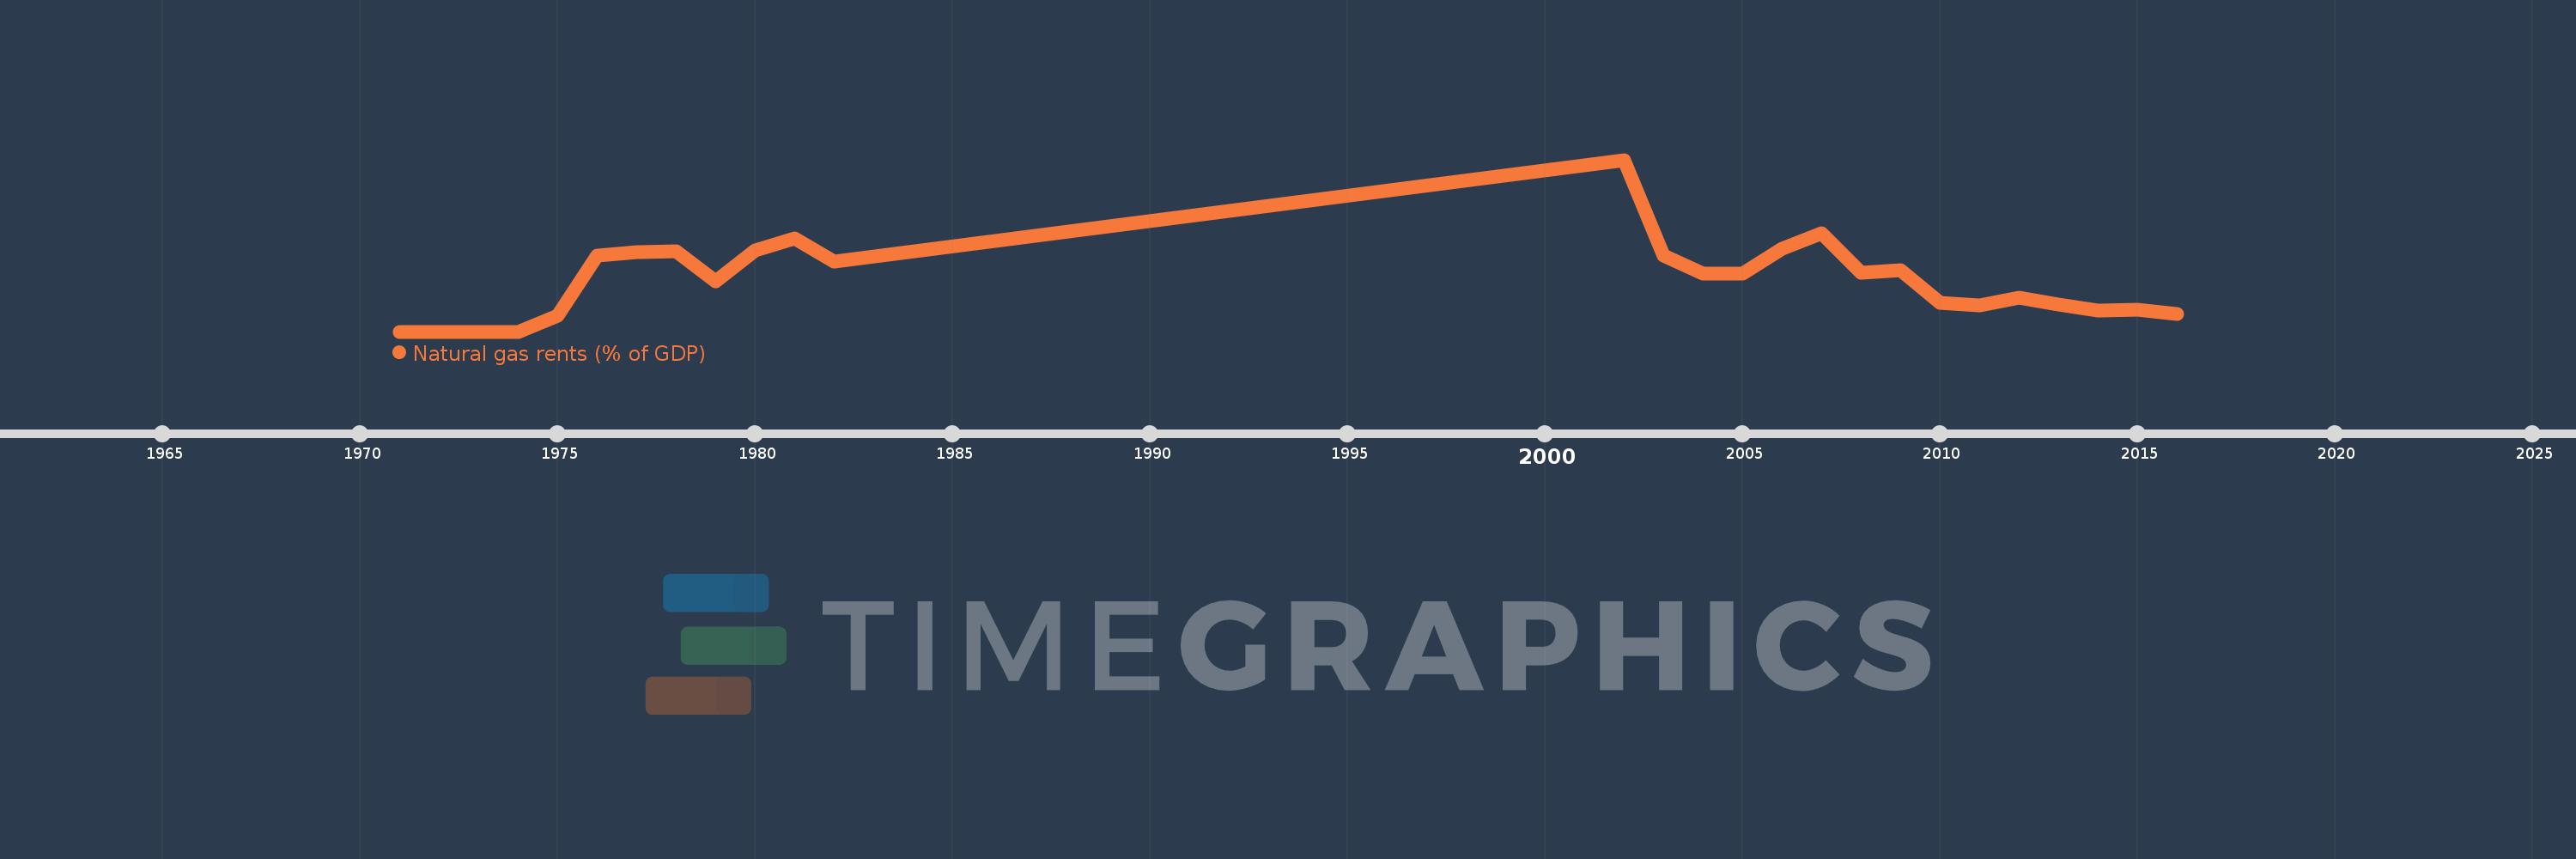
Natural gas rents (% of GDP)
2016,2015,2014,2013,2012,2011,2010,2009,2008,2007,2006,2005,2004,2003,2002,1982,1981,1980,1979,1978,1977,1976,1975,1974,1973,1972,1971
Cette statistique dans les autres pays:
La ligne de temps
Cette échelle de temps montre un graphique de 1971 année à 2016 année Afghanistan. Les données jusqu'à 1970 année ne sont pas présentés. Quantité d'observations actuelles selon dates: 27.
Source (désignation):
Les indicateurs du développement mondiale
Source (organisation):
Estimates based on sources and methods described in "The Changing Wealth of Nations: Measuring Sustainable Development in the New Millennium" (World Bank, 2011).
Catégories:
Energy & Mining, Environment
Dernière mise à jour
23 avr. 2017
Les indicateurs de changement de valeurs selon les années
Maximum:
1.169
1 janv. 2002
Pour la date d''observation
Valeur
Changement absolu
Le changement par rapport à la valeur précédente
1 janv. 1975
0.111
+0.111
%
1 janv. 1976
0.516
+0.405
366.4%
1 janv. 1977
0.54
+0.024
4.7%
1 janv. 1978
0.545
+0.005
0.95%
1 janv. 1979
0.342
-0.204
-37.33%
1 janv. 1980
0.554
+0.212
62.03%
1 janv. 1981
0.632
+0.078
14.12%
1 janv. 1982
0.477
-0.155
-24.54%
1 janv. 2002
1.169
+0.692
145.03%
1 janv. 2003
0.518
-0.65
-55.66%
1 janv. 2004
0.394
-0.124
-24.01%
1 janv. 2005
0.396
+0.002
0.54%
1 janv. 2006
0.563
+0.167
42.11%
1 janv. 2007
0.667
+0.104
18.49%
1 janv. 2008
0.403
-0.263
-39.52%
1 janv. 2009
0.418
+0.014
3.56%
1 janv. 2010
0.195
-0.222
-53.19%
1 janv. 2011
0.178
-0.018
-9.14%
1 janv. 2012
0.231
+0.053
29.94%
1 janv. 2013
0.182
-0.049
-21.25%
1 janv. 2014
0.146
-0.036
-19.6%
1 janv. 2015
0.147
+0.001
0.93%
1 janv. 2016
0.118
-0.029
-19.97%
Classement des pays selon les statistiques actuelles par années


Commentaires: