29
/fr/
fr
AIzaSyAYiBZKx7MnpbEhh9jyipgxe19OcubqV5w
April 1, 2024
222523
Peru
PER
true
2
1
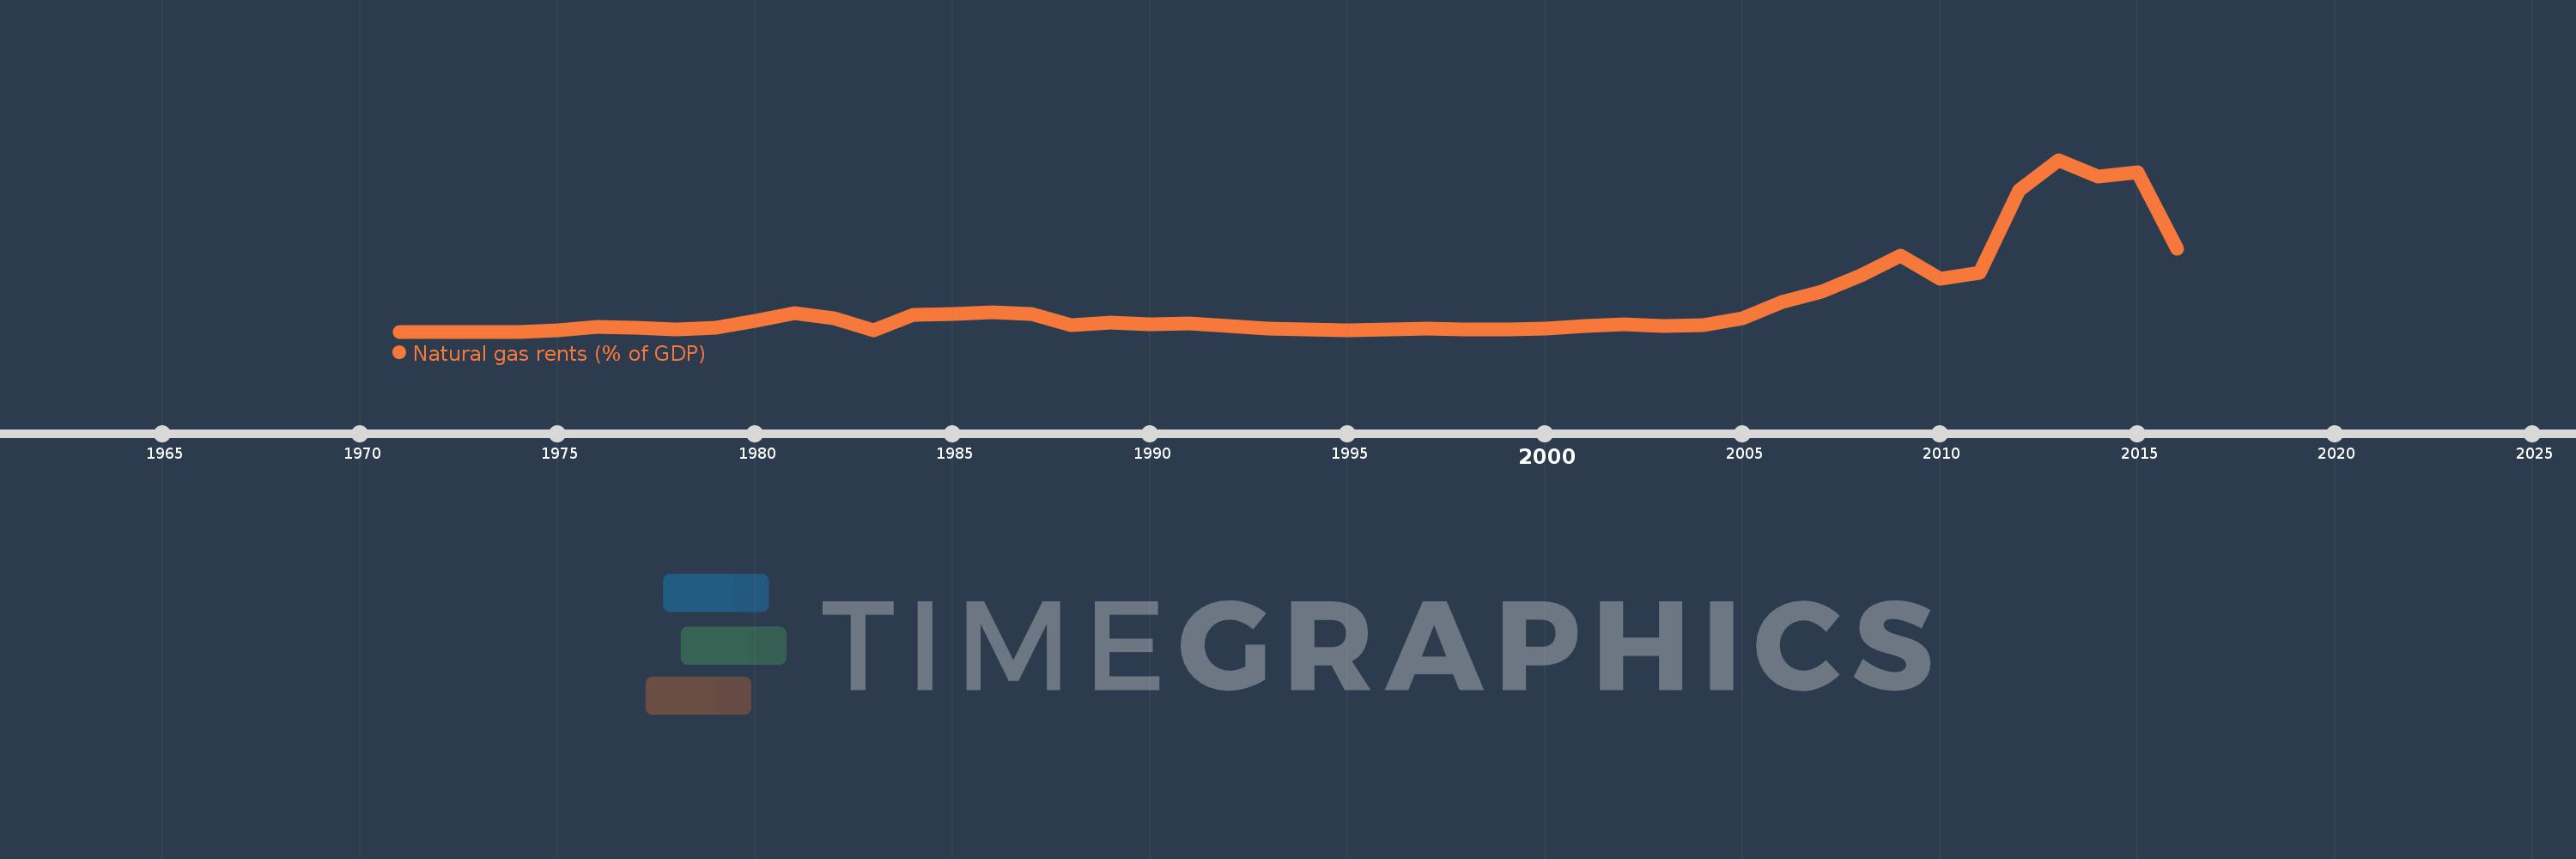
Natural gas rents (% of GDP)
2016,2015,2014,2013,2012,2011,2010,2009,2008,2007,2006,2005,2004,2003,2002,2001,2000,1999,1998,1997,1996,1995,1994,1993,1992,1991,1990,1989,1988,1987,1986,1985,1984,1983,1982,1981,1980,1979,1978,1977,1976,1975,1974,1973,1972,1971
Cette statistique dans les autres pays:
La ligne de temps
Cette échelle de temps montre un graphique de 1971 année à 2016 année Peru. Les données jusqu'à 1970 année ne sont pas présentés. Quantité d'observations actuelles selon dates: 46.
Source (désignation):
Les indicateurs du développement mondiale
Source (organisation):
Estimates based on sources and methods described in "The Changing Wealth of Nations: Measuring Sustainable Development in the New Millennium" (World Bank, 2011).
Catégories:
Energy & Mining, Environment
Dernière mise à jour
23 avr. 2017
Les indicateurs de changement de valeurs selon les années
Maximum:
0.547
1 janv. 2013
Pour la date d''observation
Valeur
Changement absolu
Le changement par rapport à la valeur précédente
1 janv. 1975
0.004
+0.004
%
1 janv. 1976
0.014
+0.01
277.7%
1 janv. 1977
0.011
-0.003
-18.25%
1 janv. 1978
0.008
-0.003
-30.17%
1 janv. 1979
0.011
+0.003
36.53%
1 janv. 1980
0.033
+0.022
200.98%
1 janv. 1981
0.06
+0.028
84.97%
1 janv. 1982
0.043
-0.018
-29.26%
1 janv. 1983
0.004
-0.039
-90.85%
1 janv. 1984
0.053
+0.049
1.25 milles%
1 janv. 1985
0.057
+0.004
8.29%
1 janv. 1986
0.061
+0.004
7.47%
1 janv. 1987
0.057
-0.004
-7.27%
1 janv. 1988
0.021
-0.036
-62.68%
1 janv. 1989
0.029
+0.008
38.01%
1 janv. 1990
0.023
-0.007
-23.15%
1 janv. 1991
0.027
+0.004
19.41%
1 janv. 1992
0.018
-0.009
-32.99%
1 janv. 1993
0.01
-0.008
-44.79%
1 janv. 1994
0.008
-0.002
-24.18%
1 janv. 1995
0.004
-0.004
-52.14%
1 janv. 1996
0.007
+0.003
91.49%
1 janv. 1997
0.01
+0.004
51.45%
1 janv. 1998
0.008
-0.003
-24.04%
1 janv. 1999
0.007
-0.001
-14.68%
1 janv. 2000
0.009
+0.002
31.29%
1 janv. 2001
0.019
+0.01
108.93%
1 janv. 2002
0.022
+0.004
18.98%
1 janv. 2003
0.019
-0.003
-12.04%
1 janv. 2004
0.021
+0.002
8.66%
1 janv. 2005
0.042
+0.021
98.83%
1 janv. 2006
0.094
+0.052
123.97%
1 janv. 2007
0.127
+0.033
34.81%
1 janv. 2008
0.178
+0.051
40.09%
1 janv. 2009
0.242
+0.064
35.87%
1 janv. 2010
0.167
-0.075
-30.92%
1 janv. 2011
0.186
+0.019
11.6%
1 janv. 2012
0.451
+0.264
141.73%
1 janv. 2013
0.547
+0.097
21.43%
1 janv. 2014
0.495
-0.052
-9.57%
1 janv. 2015
0.507
+0.012
2.35%
1 janv. 2016
0.263
-0.244
-48.15%
Classement des pays selon les statistiques actuelles par années


Commentaires: