29
/fr/
fr
AIzaSyAYiBZKx7MnpbEhh9jyipgxe19OcubqV5w
April 1, 2024
164047
Japan
JPN
true
2
1
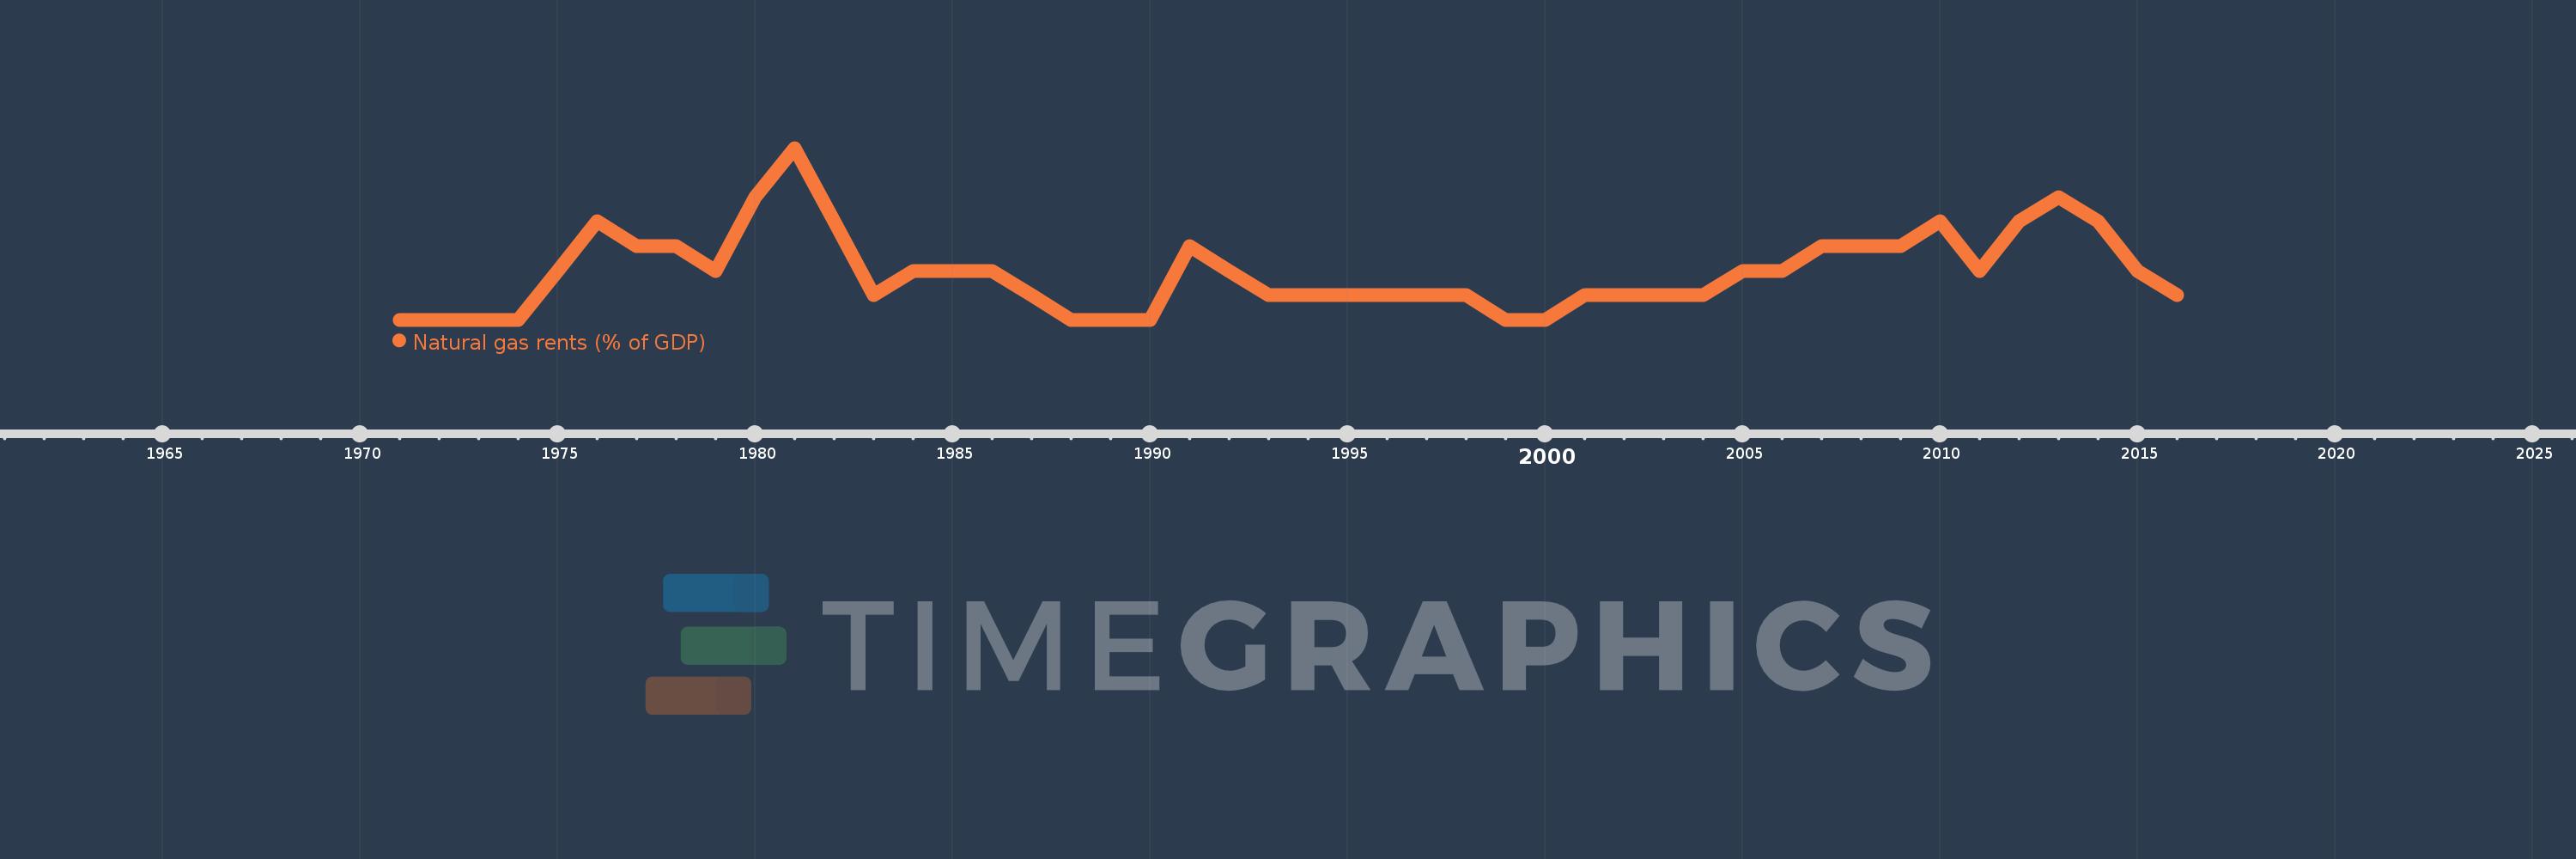
Natural gas rents (% of GDP)
2016,2015,2014,2013,2012,2011,2010,2009,2008,2007,2006,2005,2004,2003,2002,2001,2000,1999,1998,1997,1996,1995,1994,1993,1992,1991,1990,1989,1988,1987,1986,1985,1984,1983,1982,1981,1980,1979,1978,1977,1976,1975,1974,1973,1972,1971
Cette statistique dans les autres pays:
La ligne de temps
Cette échelle de temps montre un graphique de 1971 année à 2016 année Japan. Les données jusqu'à 1970 année ne sont pas présentés. Quantité d'observations actuelles selon dates: 46.
Source (désignation):
Les indicateurs du développement mondiale
Source (organisation):
Estimates based on sources and methods described in "The Changing Wealth of Nations: Measuring Sustainable Development in the New Millennium" (World Bank, 2011).
Catégories:
Energy & Mining, Environment
Dernière mise à jour
23 avr. 2017
Les indicateurs de changement de valeurs selon les années
Maximum:
0.007
1 janv. 1981
Pour la date d''observation
Valeur
Changement absolu
Le changement par rapport à la valeur précédente
1 janv. 1974
0.0
0.0
-100.0%
1 janv. 1975
0.002
+0.002
%
1 janv. 1976
0.004
+0.002
121.85%
1 janv. 1977
0.003
0.0
-7.42%
1 janv. 1978
0.003
0.0
-10.87%
1 janv. 1979
0.002
-0.001
-31.89%
1 janv. 1980
0.005
+0.003
135.01%
1 janv. 1981
0.007
+0.003
52.23%
1 janv. 1982
0.004
-0.003
-45.95%
1 janv. 1983
0.001
-0.003
-86.78%
1 janv. 1984
0.002
+0.002
350.22%
1 janv. 1985
0.002
0.0
-1.57%
1 janv. 1986
0.002
0.0
-13.99%
1 janv. 1987
0.001
-0.001
-41.57%
1 janv. 1988
0.0
-0.001
-63.71%
1 janv. 1989
0.0
0.0
-45.81%
1 janv. 1990
0.0
0.0
-5.67%
1 janv. 1991
0.003
+0.002
1.13 milles%
1 janv. 1992
0.002
0.0
-11.79%
1 janv. 1993
0.001
-0.001
-50.29%
1 janv. 1994
0.001
+0.0
4.11%
1 janv. 1995
0.001
0.0
-2.28%
1 janv. 1996
0.001
0.0
-26.52%
1 janv. 1997
0.001
+0.0
0.64%
1 janv. 1998
0.001
+0.0
2.19%
1 janv. 1999
0.0
-0.001
-86.54%
1 janv. 2000
0.0
+0.0
97.02%
1 janv. 2001
0.001
+0.001
452.87%
1 janv. 2002
0.001
0.0
-24.23%
1 janv. 2003
0.001
+0.0
14.67%
1 janv. 2004
0.001
+0.0
26.7%
1 janv. 2005
0.002
+0.0
13.74%
1 janv. 2006
0.002
0.0
-1.06%
1 janv. 2007
0.003
+0.001
64.55%
1 janv. 2008
0.003
+0.0
3.73%
1 janv. 2009
0.003
+0.0
10.76%
1 janv. 2010
0.004
+0.001
29.43%
1 janv. 2011
0.002
-0.002
-39.12%
1 janv. 2012
0.004
+0.002
74.98%
1 janv. 2013
0.005
+0.001
21.69%
1 janv. 2014
0.004
-0.002
-30.74%
1 janv. 2015
0.002
-0.001
-35.98%
1 janv. 2016
0.001
-0.001
-53.82%
Classement des pays selon les statistiques actuelles par années


Commentaires: