29
/fr/
fr
AIzaSyAYiBZKx7MnpbEhh9jyipgxe19OcubqV5w
April 1, 2024
43677
Latin America & the Caribbean (IDA & IBRD countries)
TLA
false
2
1
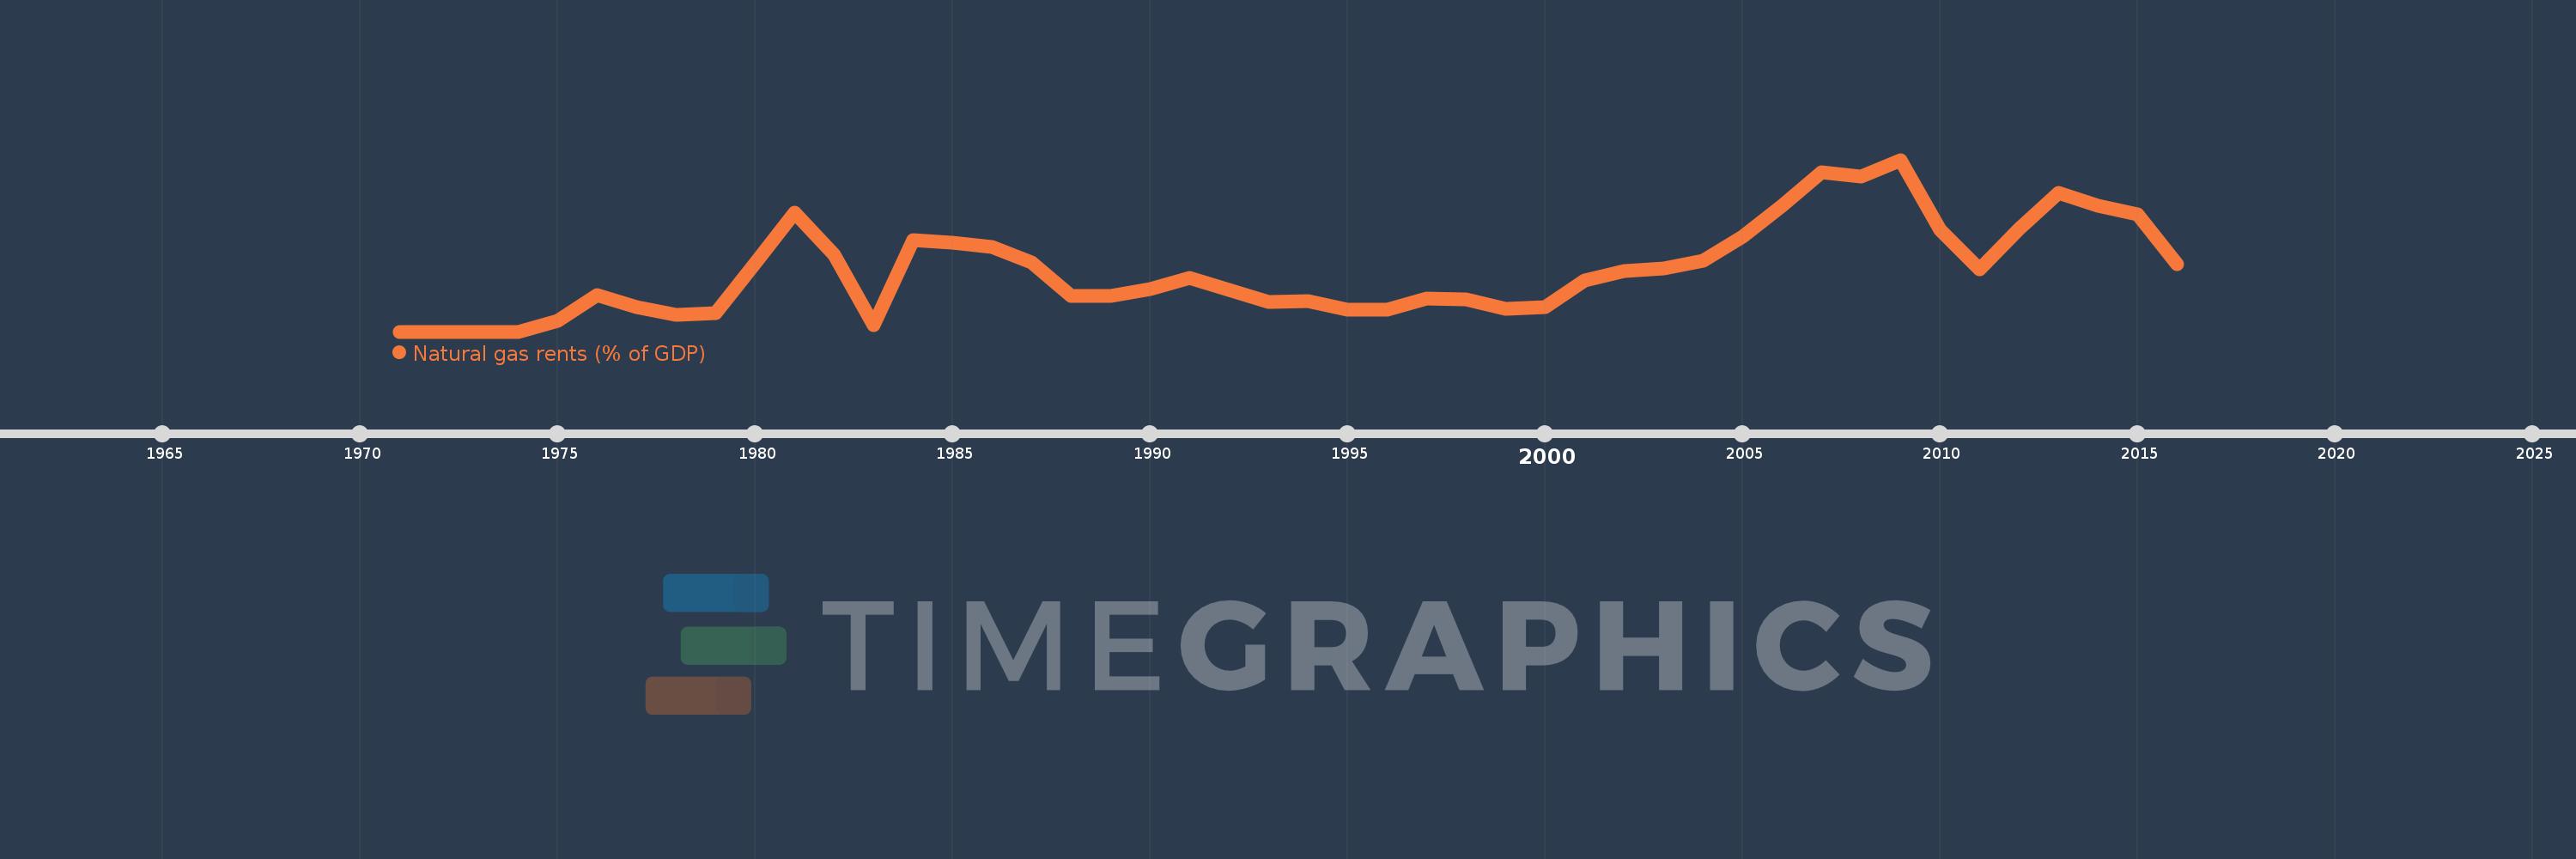
Natural gas rents (% of GDP)
2016,2015,2014,2013,2012,2011,2010,2009,2008,2007,2006,2005,2004,2003,2002,2001,2000,1999,1998,1997,1996,1995,1994,1993,1992,1991,1990,1989,1988,1987,1986,1985,1984,1983,1982,1981,1980,1979,1978,1977,1976,1975,1974,1973,1972,1971
Cette statistique dans les autres pays:
La ligne de temps
Cette échelle de temps montre un graphique de 1971 année à 2016 année Latin America & the Caribbean (IDA & IBRD countries). Les données jusqu'à 1970 année ne sont pas présentés. Quantité d'observations actuelles selon dates: 46.
Source (désignation):
Les indicateurs du développement mondiale
Source (organisation):
Estimates based on sources and methods described in "The Changing Wealth of Nations: Measuring Sustainable Development in the New Millennium" (World Bank, 2011).
Catégories:
Energy & Mining, Environment
Dernière mise à jour
23 avr. 2017
Les indicateurs de changement de valeurs selon les années
Maximum:
0.341
1 janv. 2009
Pour la date d''observation
Valeur
Changement absolu
Le changement par rapport à la valeur précédente
1 janv. 1975
0.021
+0.021
%
1 janv. 1976
0.073
+0.052
252.18%
1 janv. 1977
0.048
-0.025
-34.33%
1 janv. 1978
0.033
-0.015
-30.61%
1 janv. 1979
0.037
+0.004
10.74%
1 janv. 1980
0.136
+0.099
269.91%
1 janv. 1981
0.236
+0.1
74.03%
1 janv. 1982
0.152
-0.084
-35.76%
1 janv. 1983
0.012
-0.14
-92.14%
1 janv. 1984
0.182
+0.17
1.43 milles%
1 janv. 1985
0.176
-0.006
-3.09%
1 janv. 1986
0.168
-0.008
-4.36%
1 janv. 1987
0.138
-0.031
-18.23%
1 janv. 1988
0.071
-0.067
-48.46%
1 janv. 1989
0.071
+0.0
0.07%
1 janv. 1990
0.084
+0.013
18.2%
1 janv. 1991
0.107
+0.023
27.97%
1 janv. 1992
0.083
-0.024
-22.33%
1 janv. 1993
0.058
-0.026
-30.62%
1 janv. 1994
0.06
+0.003
4.37%
1 janv. 1995
0.044
-0.016
-26.75%
1 janv. 1996
0.044
0.0
-0.06%
1 janv. 1997
0.065
+0.021
47.03%
1 janv. 1998
0.064
-0.001
-1.26%
1 janv. 1999
0.046
-0.018
-27.77%
1 janv. 2000
0.048
+0.002
4.23%
1 janv. 2001
0.101
+0.052
107.85%
1 janv. 2002
0.121
+0.021
20.82%
1 janv. 2003
0.126
+0.004
3.51%
1 janv. 2004
0.141
+0.015
11.86%
1 janv. 2005
0.188
+0.048
33.92%
1 janv. 2006
0.25
+0.062
32.99%
1 janv. 2007
0.316
+0.065
26.08%
1 janv. 2008
0.308
-0.008
-2.53%
1 janv. 2009
0.341
+0.034
10.89%
1 janv. 2010
0.202
-0.139
-40.76%
1 janv. 2011
0.124
-0.078
-38.68%
1 janv. 2012
0.204
+0.08
64.41%
1 janv. 2013
0.276
+0.072
35.39%
1 janv. 2014
0.249
-0.026
-9.59%
1 janv. 2015
0.232
-0.018
-7.16%
1 janv. 2016
0.133
-0.098
-42.46%
Classement des pays selon les statistiques actuelles par années


Commentaires: