29
/fr/
fr
AIzaSyAYiBZKx7MnpbEhh9jyipgxe19OcubqV5w
April 1, 2024
51605
Middle income
MIC
false
2
1
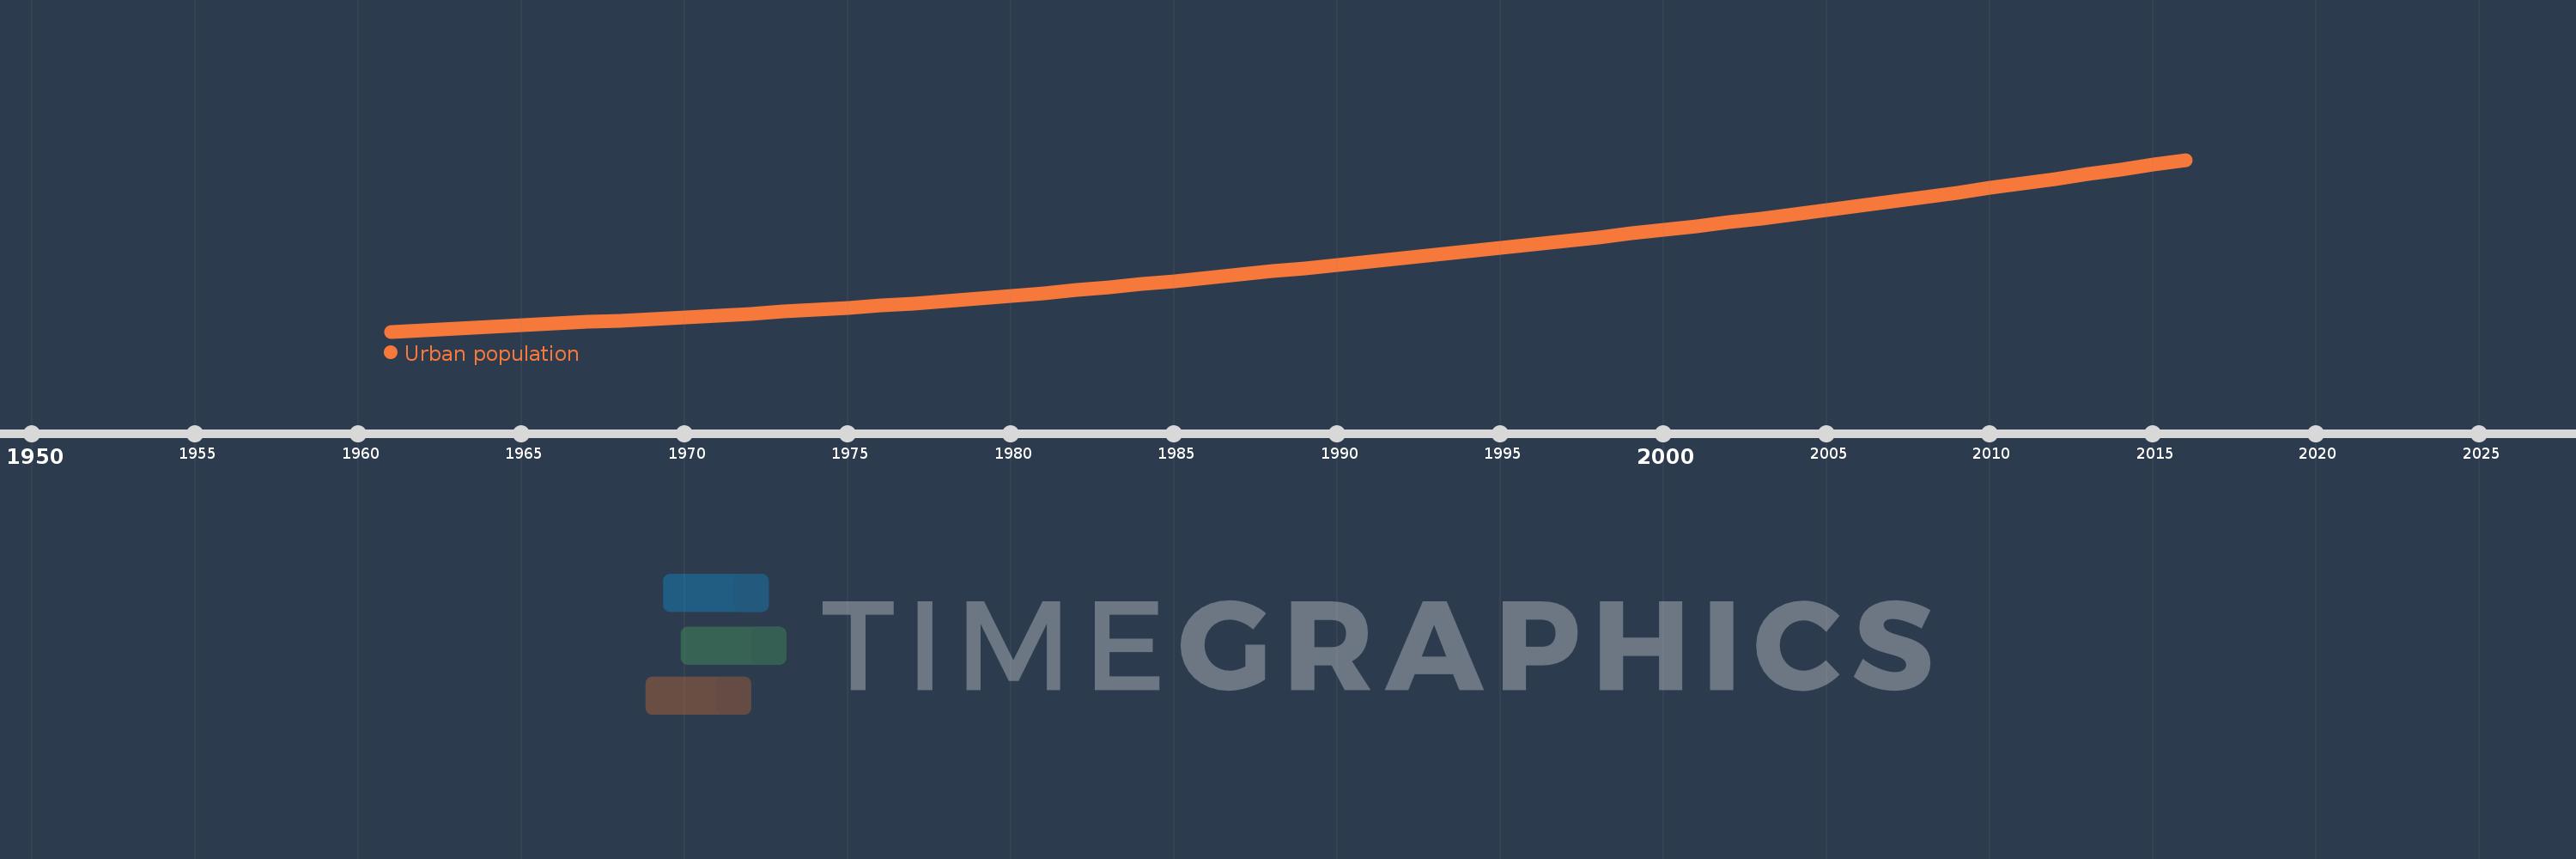
Urban population
2016,2015,2014,2013,2012,2011,2010,2009,2008,2007,2006,2005,2004,2003,2002,2001,2000,1999,1998,1997,1996,1995,1994,1993,1992,1991,1990,1989,1988,1987,1986,1985,1984,1983,1982,1981,1980,1979,1978,1977,1976,1975,1974,1973,1972,1971,1970,1969,1968,1967,1966,1965,1964,1963,1962,1961
Cette statistique dans les autres pays:
AfghanistanAlbaniaAlgeriaAmerican SamoaAndorraAngolaAntigua and BarbudaArab WorldArgentinaArmeniaArubaAustraliaAustriaAzerbaijanBahamas, TheBahrainBangladeshBarbadosBelarusBelgiumBelizeBeninBermudaBhutanBoliviaBosnia and HerzegovinaBotswanaBrazilBritish Virgin IslandsBrunei DarussalamBulgariaBurkina FasoBurundiCabo VerdeCambodiaCameroonCanadaCaribbean small statesCayman IslandsCentral African RepublicCentral Europe and the BalticsChadChannel IslandsChileChinaColombiaComorosCongo, Dem. Rep.Congo, Rep.Costa RicaCote d'IvoireCroatiaCubaCuracaoCyprusCzech RepublicDenmarkDjiboutiDominicaDominican RepublicEarly-demographic dividendEast Asia & PacificEast Asia & Pacific (excluding high income)East Asia & Pacific (IDA & IBRD countries)EcuadorEgypt, Arab Rep.El SalvadorEquatorial GuineaEritreaEstoniaEthiopiaEuro areaEurope & Central AsiaEurope & Central Asia (excluding high income)Europe & Central Asia (IDA & IBRD countries)European UnionFaroe IslandsFijiFinlandFragile and conflict affected situationsFranceFrench PolynesiaGabonGambia, TheGeorgiaGermanyGhanaGibraltarGreeceGreenlandGrenadaGuamGuatemalaGuineaGuinea-BissauGuyanaHaitiHeavily indebted poor countries (HIPC)High incomeHondurasHong Kong SAR, ChinaHungaryIBRD onlyIcelandIDA & IBRD totalIDA blendIDA onlyIDA totalIndiaIndonesiaIran, Islamic Rep.IraqIrelandIsle of ManIsraelItalyJamaicaJapanJordanKazakhstanKenyaKiribatiKorea, Dem. People’s Rep.Korea, Rep.KuwaitKyrgyz RepublicLao PDRLate-demographic dividendLatin America & Caribbean Latin America & Caribbean (excluding high income)Latin America & the Caribbean (IDA & IBRD countries)LatviaLeast developed countries: UN classificationLebanonLesothoLiberiaLibyaLiechtensteinLithuaniaLow & middle incomeLow incomeLower middle incomeLuxembourgMacao SAR, ChinaMacedonia, FYRMadagascarMalawiMalaysiaMaldivesMaliMaltaMarshall IslandsMauritaniaMauritiusMexicoMicronesia, Fed. Sts.Middle East & North AfricaMiddle East & North Africa (excluding high income)Middle East & North Africa (IDA & IBRD countries)Middle incomeMoldovaMonacoMongoliaMontenegroMoroccoMozambiqueMyanmarNamibiaNauruNepalNetherlandsNew CaledoniaNew ZealandNicaraguaNigerNigeriaNorth AmericaNorthern Mariana IslandsNorwayOECD membersOmanOther small statesPacific island small statesPakistanPalauPanamaPapua New GuineaParaguayPeruPhilippinesPolandPortugalPost-demographic dividendPre-demographic dividendPuerto RicoQatarRomaniaRussian FederationRwandaSamoaSan MarinoSao Tome and PrincipeSaudi ArabiaSenegalSerbiaSeychellesSierra LeoneSingaporeSint Maarten (Dutch part)Slovak RepublicSloveniaSmall statesSolomon IslandsSomaliaSouth AfricaSouth AsiaSouth Asia (IDA & IBRD)South SudanSpainSri LankaSt. Kitts and NevisSt. LuciaSt. Vincent and the GrenadinesSub-Saharan Africa Sub-Saharan Africa (excluding high income)Sub-Saharan Africa (IDA & IBRD countries)SudanSurinameSwazilandSwedenSwitzerlandSyrian Arab RepublicTajikistanTanzaniaThailandTimor-LesteTogoTongaTrinidad and TobagoTunisiaTurkeyTurkmenistanTurks and Caicos IslandsTuvaluUgandaUkraineUnited Arab EmiratesUnited KingdomUnited StatesUpper middle incomeUruguayUzbekistanVanuatuVenezuela, RBVietnamVirgin Islands (U.S.)West Bank and GazaWorldYemen, Rep.ZambiaZimbabwe La ligne de temps
Cette échelle de temps montre un graphique de 1961 année à 2016 année Middle income. Les données jusqu'à 1960 année ne sont pas présentés. Quantité d'observations actuelles selon dates: 56.
Source (désignation):
Les indicateurs du développement mondiale
Source (organisation):
World Bank Staff estimates based on United Nations, World Urbanization Prospects.
Catégories:
Climate Change, Urban Development
Dernière mise à jour
23 avr. 2017
Les indicateurs de changement de valeurs selon les années
Minimum:
518.843 mln.
1 janv. 1961
Maximum:
2.803 mds
1 janv. 2016
Pour la date d''observation
Valeur
Changement absolu
Le changement par rapport à la valeur précédente
1 janv. 1961
518.843 mln.
+518.843 mln.
0.0%
1 janv. 1962
536.602 mln.
+17.758 mln.
3.42%
1 janv. 1963
557.365 mln.
+20.764 mln.
3.87%
1 janv. 1964
580.8 mln.
+23.435 mln.
4.2%
1 janv. 1965
604.995 mln.
+24.195 mln.
4.17%
1 janv. 1966
624.552 mln.
+19.557 mln.
3.23%
1 janv. 1967
644.998 mln.
+20.446 mln.
3.27%
1 janv. 1968
665.984 mln.
+20.986 mln.
3.25%
1 janv. 1969
687.63 mln.
+21.645 mln.
3.25%
1 janv. 1970
710.068 mln.
+22.439 mln.
3.26%
1 janv. 1971
733.161 mln.
+23.093 mln.
3.25%
1 janv. 1972
757.5 mln.
+24.338 mln.
3.32%
1 janv. 1973
782.903 mln.
+25.404 mln.
3.35%
1 janv. 1974
809.674 mln.
+26.77 mln.
3.42%
1 janv. 1975
837.835 mln.
+28.162 mln.
3.48%
1 janv. 1976
864.342 mln.
+26.507 mln.
3.16%
1 janv. 1977
892.766 mln.
+28.424 mln.
3.29%
1 janv. 1978
921.558 mln.
+28.791 mln.
3.22%
1 janv. 1979
954.259 mln.
+32.702 mln.
3.55%
1 janv. 1980
990.94 mln.
+36.681 mln.
3.84%
1 janv. 1981
1.029 mds
+37.925 mln.
3.83%
1 janv. 1982
1.068 mds
+39.444 mln.
3.83%
1 janv. 1983
1.108 mds
+40.003 mln.
3.74%
1 janv. 1984
1.148 mds
+39.621 mln.
3.57%
1 janv. 1985
1.189 mds
+40.763 mln.
3.55%
1 janv. 1986
1.231 mds
+41.987 mln.
3.53%
1 janv. 1987
1.274 mds
+43.284 mln.
3.52%
1 janv. 1988
1.318 mds
+44.441 mln.
3.49%
1 janv. 1989
1.364 mds
+45.24 mln.
3.43%
1 janv. 1990
1.409 mds
+45.191 mln.
3.31%
1 janv. 1991
1.455 mds
+46.007 mln.
3.27%
1 janv. 1992
1.5 mds
+44.766 mln.
3.08%
1 janv. 1993
1.544 mds
+44.546 mln.
2.97%
1 janv. 1994
1.589 mds
+44.723 mln.
2.9%
1 janv. 1995
1.634 mds
+45.118 mln.
2.84%
1 janv. 1996
1.68 mds
+45.699 mln.
2.8%
1 janv. 1997
1.726 mds
+46.404 mln.
2.76%
1 janv. 1998
1.773 mds
+47.346 mln.
2.74%
1 janv. 1999
1.822 mds
+48.122 mln.
2.71%
1 janv. 2000
1.87 mds
+48.468 mln.
2.66%
1 janv. 2001
1.919 mds
+49.104 mln.
2.63%
1 janv. 2002
1.971 mds
+51.435 mln.
2.68%
1 janv. 2003
2.025 mds
+54.035 mln.
2.74%
1 janv. 2004
2.08 mds
+55.145 mln.
2.72%
1 janv. 2005
2.136 mds
+56.14 mln.
2.7%
1 janv. 2006
2.193 mds
+57.045 mln.
2.67%
1 janv. 2007
2.25 mds
+57.311 mln.
2.61%
1 janv. 2008
2.308 mds
+57.653 mln.
2.56%
1 janv. 2009
2.367 mds
+58.784 mln.
2.55%
1 janv. 2010
2.427 mds
+59.938 mln.
2.53%
1 janv. 2011
2.488 mds
+60.959 mln.
2.51%
1 janv. 2012
2.55 mds
+62.027 mln.
2.49%
1 janv. 2013
2.612 mds
+62.719 mln.
2.46%
1 janv. 2014
2.676 mds
+63.249 mln.
2.42%
1 janv. 2015
2.739 mds
+63.623 mln.
2.38%
1 janv. 2016
2.803 mds
+63.706 mln.
2.33%
Classement des pays selon les statistiques actuelles par années


Commentaires: