29
/fr/
fr
AIzaSyAYiBZKx7MnpbEhh9jyipgxe19OcubqV5w
April 1, 2024
34697
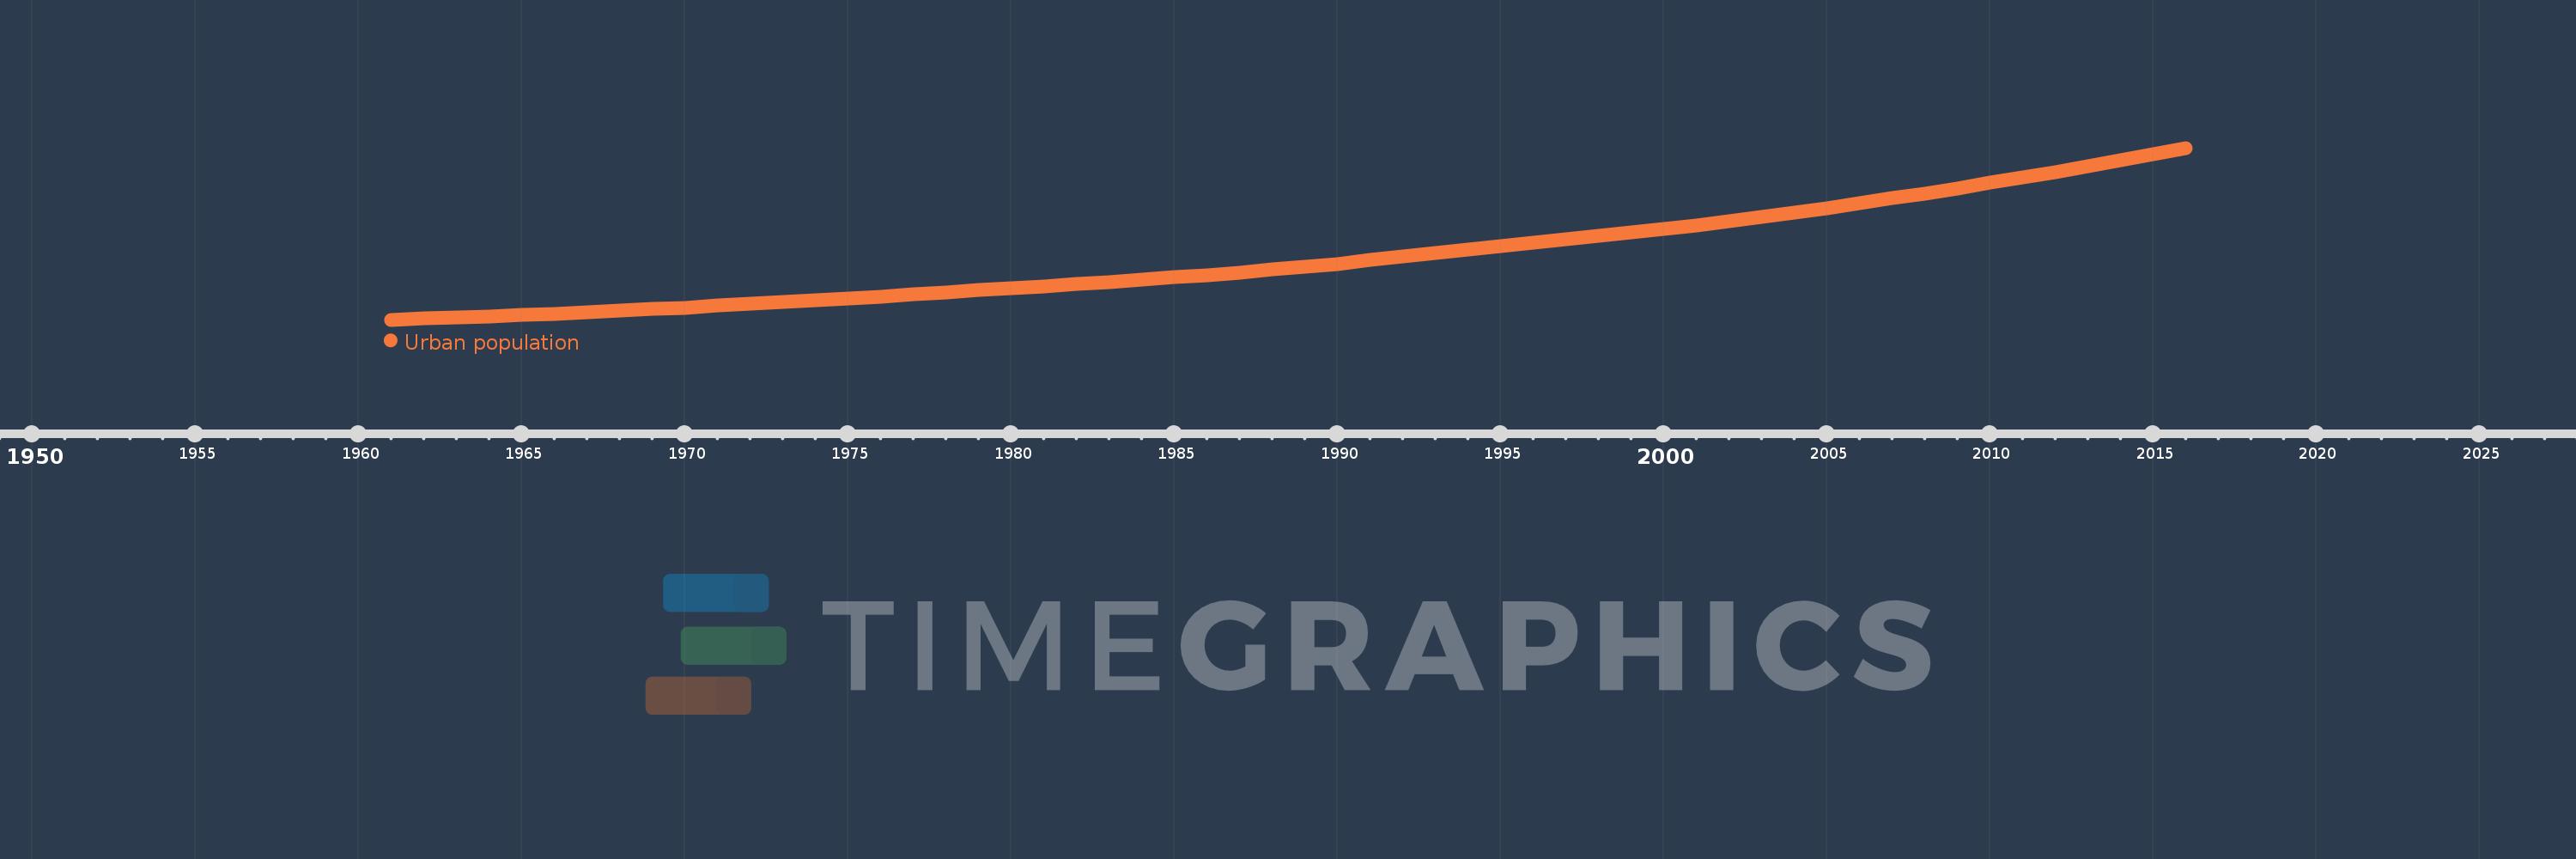
Fragile and conflict affected situations
FCS
false
2
1
Urban population
2016,2015,2014,2013,2012,2011,2010,2009,2008,2007,2006,2005,2004,2003,2002,2001,2000,1999,1998,1997,1996,1995,1994,1993,1992,1991,1990,1989,1988,1987,1986,1985,1984,1983,1982,1981,1980,1979,1978,1977,1976,1975,1974,1973,1972,1971,1970,1969,1968,1967,1966,1965,1964,1963,1962,1961
Cette statistique dans les autres pays:
AfghanistanAlbaniaAlgeriaAmerican SamoaAndorraAngolaAntigua and BarbudaArab WorldArgentinaArmeniaArubaAustraliaAustriaAzerbaijanBahamas, TheBahrainBangladeshBarbadosBelarusBelgiumBelizeBeninBermudaBhutanBoliviaBosnia and HerzegovinaBotswanaBrazilBritish Virgin IslandsBrunei DarussalamBulgariaBurkina FasoBurundiCabo VerdeCambodiaCameroonCanadaCaribbean small statesCayman IslandsCentral African RepublicCentral Europe and the BalticsChadChannel IslandsChileChinaColombiaComorosCongo, Dem. Rep.Congo, Rep.Costa RicaCote d'IvoireCroatiaCubaCuracaoCyprusCzech RepublicDenmarkDjiboutiDominicaDominican RepublicEarly-demographic dividendEast Asia & PacificEast Asia & Pacific (excluding high income)East Asia & Pacific (IDA & IBRD countries)EcuadorEgypt, Arab Rep.El SalvadorEquatorial GuineaEritreaEstoniaEthiopiaEuro areaEurope & Central AsiaEurope & Central Asia (excluding high income)Europe & Central Asia (IDA & IBRD countries)European UnionFaroe IslandsFijiFinlandFragile and conflict affected situationsFranceFrench PolynesiaGabonGambia, TheGeorgiaGermanyGhanaGibraltarGreeceGreenlandGrenadaGuamGuatemalaGuineaGuinea-BissauGuyanaHaitiHeavily indebted poor countries (HIPC)High incomeHondurasHong Kong SAR, ChinaHungaryIBRD onlyIcelandIDA & IBRD totalIDA blendIDA onlyIDA totalIndiaIndonesiaIran, Islamic Rep.IraqIrelandIsle of ManIsraelItalyJamaicaJapanJordanKazakhstanKenyaKiribatiKorea, Dem. People’s Rep.Korea, Rep.KuwaitKyrgyz RepublicLao PDRLate-demographic dividendLatin America & Caribbean Latin America & Caribbean (excluding high income)Latin America & the Caribbean (IDA & IBRD countries)LatviaLeast developed countries: UN classificationLebanonLesothoLiberiaLibyaLiechtensteinLithuaniaLow & middle incomeLow incomeLower middle incomeLuxembourgMacao SAR, ChinaMacedonia, FYRMadagascarMalawiMalaysiaMaldivesMaliMaltaMarshall IslandsMauritaniaMauritiusMexicoMicronesia, Fed. Sts.Middle East & North AfricaMiddle East & North Africa (excluding high income)Middle East & North Africa (IDA & IBRD countries)Middle incomeMoldovaMonacoMongoliaMontenegroMoroccoMozambiqueMyanmarNamibiaNauruNepalNetherlandsNew CaledoniaNew ZealandNicaraguaNigerNigeriaNorth AmericaNorthern Mariana IslandsNorwayOECD membersOmanOther small statesPacific island small statesPakistanPalauPanamaPapua New GuineaParaguayPeruPhilippinesPolandPortugalPost-demographic dividendPre-demographic dividendPuerto RicoQatarRomaniaRussian FederationRwandaSamoaSan MarinoSao Tome and PrincipeSaudi ArabiaSenegalSerbiaSeychellesSierra LeoneSingaporeSint Maarten (Dutch part)Slovak RepublicSloveniaSmall statesSolomon IslandsSomaliaSouth AfricaSouth AsiaSouth Asia (IDA & IBRD)South SudanSpainSri LankaSt. Kitts and NevisSt. LuciaSt. Vincent and the GrenadinesSub-Saharan Africa Sub-Saharan Africa (excluding high income)Sub-Saharan Africa (IDA & IBRD countries)SudanSurinameSwazilandSwedenSwitzerlandSyrian Arab RepublicTajikistanTanzaniaThailandTimor-LesteTogoTongaTrinidad and TobagoTunisiaTurkeyTurkmenistanTurks and Caicos IslandsTuvaluUgandaUkraineUnited Arab EmiratesUnited KingdomUnited StatesUpper middle incomeUruguayUzbekistanVanuatuVenezuela, RBVietnamVirgin Islands (U.S.)West Bank and GazaWorldYemen, Rep.ZambiaZimbabwe La ligne de temps
Cette échelle de temps montre un graphique de 1961 année à 2016 année Fragile and conflict affected situations. Les données jusqu'à 1960 année ne sont pas présentés. Quantité d'observations actuelles selon dates: 56.
Source (désignation):
Les indicateurs du développement mondiale
Source (organisation):
World Bank Staff estimates based on United Nations, World Urbanization Prospects.
Catégories:
Climate Change, Urban Development
Dernière mise à jour
23 avr. 2017
Les indicateurs de changement de valeurs selon les années
Minimum:
20.817 mln.
1 janv. 1961
Maximum:
197.533 mln.
1 janv. 2016
Pour la date d''observation
Valeur
Changement absolu
Le changement par rapport à la valeur précédente
1 janv. 1961
20.817 mln.
+20.817 mln.
0.0%
1 janv. 1962
21.894 mln.
+1.077 mln.
5.17%
1 janv. 1963
23.037 mln.
+1.144 mln.
5.22%
1 janv. 1964
24.26 mln.
+1.223 mln.
5.31%
1 janv. 1965
25.566 mln.
+1.305 mln.
5.38%
1 janv. 1966
26.99 mln.
+1.425 mln.
5.57%
1 janv. 1967
28.449 mln.
+1.459 mln.
5.41%
1 janv. 1968
29.992 mln.
+1.543 mln.
5.42%
1 janv. 1969
31.629 mln.
+1.636 mln.
5.46%
1 janv. 1970
33.354 mln.
+1.725 mln.
5.45%
1 janv. 1971
35.158 mln.
+1.805 mln.
5.41%
1 janv. 1972
37.003 mln.
+1.845 mln.
5.25%
1 janv. 1973
38.882 mln.
+1.879 mln.
5.08%
1 janv. 1974
40.803 mln.
+1.921 mln.
4.94%
1 janv. 1975
42.656 mln.
+1.853 mln.
4.54%
1 janv. 1976
44.601 mln.
+1.945 mln.
4.56%
1 janv. 1977
46.665 mln.
+2.065 mln.
4.63%
1 janv. 1978
48.833 mln.
+2.167 mln.
4.64%
1 janv. 1979
51.061 mln.
+2.228 mln.
4.56%
1 janv. 1980
53.196 mln.
+2.136 mln.
4.18%
1 janv. 1981
55.322 mln.
+2.125 mln.
4.0%
1 janv. 1982
57.454 mln.
+2.132 mln.
3.85%
1 janv. 1983
59.595 mln.
+2.142 mln.
3.73%
1 janv. 1984
61.876 mln.
+2.281 mln.
3.83%
1 janv. 1985
64.338 mln.
+2.462 mln.
3.98%
1 janv. 1986
66.912 mln.
+2.574 mln.
4.0%
1 janv. 1987
69.577 mln.
+2.664 mln.
3.98%
1 janv. 1988
72.34 mln.
+2.764 mln.
3.97%
1 janv. 1989
75.141 mln.
+2.801 mln.
3.87%
1 janv. 1990
78.067 mln.
+2.926 mln.
3.89%
1 janv. 1991
82.539 mln.
+4.472 mln.
5.73%
1 janv. 1992
85.96 mln.
+3.421 mln.
4.14%
1 janv. 1993
89.497 mln.
+3.537 mln.
4.11%
1 janv. 1994
93.072 mln.
+3.576 mln.
4.0%
1 janv. 1995
96.444 mln.
+3.372 mln.
3.62%
1 janv. 1996
99.86 mln.
+3.416 mln.
3.54%
1 janv. 1997
103.286 mln.
+3.426 mln.
3.43%
1 janv. 1998
106.814 mln.
+3.528 mln.
3.42%
1 janv. 1999
110.41 mln.
+3.596 mln.
3.37%
1 janv. 2000
114.174 mln.
+3.764 mln.
3.41%
1 janv. 2001
118.116 mln.
+3.942 mln.
3.45%
1 janv. 2002
122.325 mln.
+4.209 mln.
3.56%
1 janv. 2003
126.705 mln.
+4.38 mln.
3.58%
1 janv. 2004
131.183 mln.
+4.479 mln.
3.53%
1 janv. 2005
135.81 mln.
+4.627 mln.
3.53%
1 janv. 2006
140.643 mln.
+4.832 mln.
3.56%
1 janv. 2007
145.639 mln.
+4.996 mln.
3.55%
1 janv. 2008
150.823 mln.
+5.184 mln.
3.56%
1 janv. 2009
156.171 mln.
+5.348 mln.
3.55%
1 janv. 2010
161.654 mln.
+5.483 mln.
3.51%
1 janv. 2011
167.255 mln.
+5.601 mln.
3.46%
1 janv. 2012
172.968 mln.
+5.713 mln.
3.42%
1 janv. 2013
178.804 mln.
+5.835 mln.
3.37%
1 janv. 2014
184.803 mln.
+5.999 mln.
3.36%
1 janv. 2015
191.031 mln.
+6.228 mln.
3.37%
1 janv. 2016
197.533 mln.
+6.502 mln.
3.4%
Classement des pays selon les statistiques actuelles par années


Commentaires: