29
/fr/
fr
AIzaSyAYiBZKx7MnpbEhh9jyipgxe19OcubqV5w
April 1, 2024
158110
Iran, Islamic Rep.
IRN
true
2
1
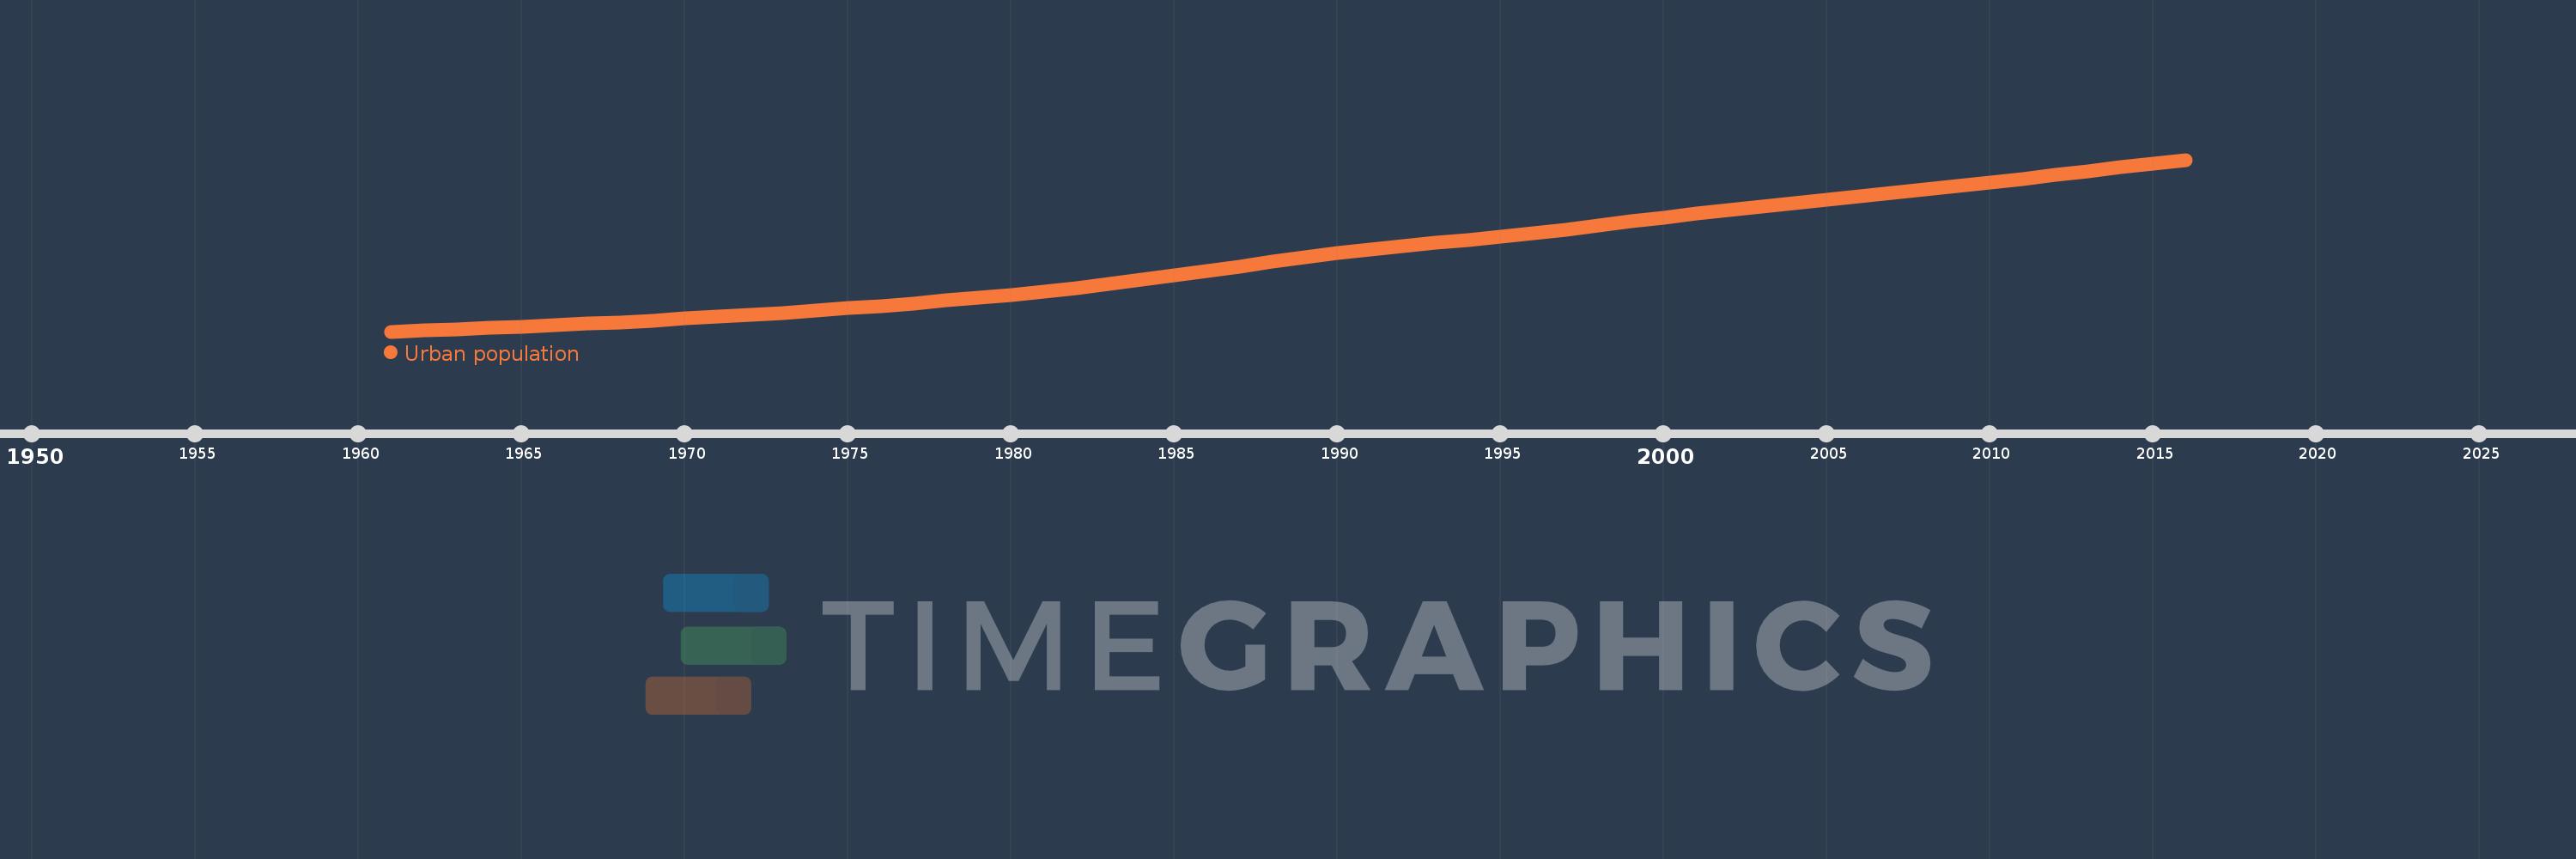
Urban population
2016,2015,2014,2013,2012,2011,2010,2009,2008,2007,2006,2005,2004,2003,2002,2001,2000,1999,1998,1997,1996,1995,1994,1993,1992,1991,1990,1989,1988,1987,1986,1985,1984,1983,1982,1981,1980,1979,1978,1977,1976,1975,1974,1973,1972,1971,1970,1969,1968,1967,1966,1965,1964,1963,1962,1961
Cette statistique dans les autres pays:
AfghanistanAlbaniaAlgeriaAmerican SamoaAndorraAngolaAntigua and BarbudaArab WorldArgentinaArmeniaArubaAustraliaAustriaAzerbaijanBahamas, TheBahrainBangladeshBarbadosBelarusBelgiumBelizeBeninBermudaBhutanBoliviaBosnia and HerzegovinaBotswanaBrazilBritish Virgin IslandsBrunei DarussalamBulgariaBurkina FasoBurundiCabo VerdeCambodiaCameroonCanadaCaribbean small statesCayman IslandsCentral African RepublicCentral Europe and the BalticsChadChannel IslandsChileChinaColombiaComorosCongo, Dem. Rep.Congo, Rep.Costa RicaCote d'IvoireCroatiaCubaCuracaoCyprusCzech RepublicDenmarkDjiboutiDominicaDominican RepublicEarly-demographic dividendEast Asia & PacificEast Asia & Pacific (excluding high income)East Asia & Pacific (IDA & IBRD countries)EcuadorEgypt, Arab Rep.El SalvadorEquatorial GuineaEritreaEstoniaEthiopiaEuro areaEurope & Central AsiaEurope & Central Asia (excluding high income)Europe & Central Asia (IDA & IBRD countries)European UnionFaroe IslandsFijiFinlandFragile and conflict affected situationsFranceFrench PolynesiaGabonGambia, TheGeorgiaGermanyGhanaGibraltarGreeceGreenlandGrenadaGuamGuatemalaGuineaGuinea-BissauGuyanaHaitiHeavily indebted poor countries (HIPC)High incomeHondurasHong Kong SAR, ChinaHungaryIBRD onlyIcelandIDA & IBRD totalIDA blendIDA onlyIDA totalIndiaIndonesiaIran, Islamic Rep.IraqIrelandIsle of ManIsraelItalyJamaicaJapanJordanKazakhstanKenyaKiribatiKorea, Dem. People’s Rep.Korea, Rep.KuwaitKyrgyz RepublicLao PDRLate-demographic dividendLatin America & Caribbean Latin America & Caribbean (excluding high income)Latin America & the Caribbean (IDA & IBRD countries)LatviaLeast developed countries: UN classificationLebanonLesothoLiberiaLibyaLiechtensteinLithuaniaLow & middle incomeLow incomeLower middle incomeLuxembourgMacao SAR, ChinaMacedonia, FYRMadagascarMalawiMalaysiaMaldivesMaliMaltaMarshall IslandsMauritaniaMauritiusMexicoMicronesia, Fed. Sts.Middle East & North AfricaMiddle East & North Africa (excluding high income)Middle East & North Africa (IDA & IBRD countries)Middle incomeMoldovaMonacoMongoliaMontenegroMoroccoMozambiqueMyanmarNamibiaNauruNepalNetherlandsNew CaledoniaNew ZealandNicaraguaNigerNigeriaNorth AmericaNorthern Mariana IslandsNorwayOECD membersOmanOther small statesPacific island small statesPakistanPalauPanamaPapua New GuineaParaguayPeruPhilippinesPolandPortugalPost-demographic dividendPre-demographic dividendPuerto RicoQatarRomaniaRussian FederationRwandaSamoaSan MarinoSao Tome and PrincipeSaudi ArabiaSenegalSerbiaSeychellesSierra LeoneSingaporeSint Maarten (Dutch part)Slovak RepublicSloveniaSmall statesSolomon IslandsSomaliaSouth AfricaSouth AsiaSouth Asia (IDA & IBRD)South SudanSpainSri LankaSt. Kitts and NevisSt. LuciaSt. Vincent and the GrenadinesSub-Saharan Africa Sub-Saharan Africa (excluding high income)Sub-Saharan Africa (IDA & IBRD countries)SudanSurinameSwazilandSwedenSwitzerlandSyrian Arab RepublicTajikistanTanzaniaThailandTimor-LesteTogoTongaTrinidad and TobagoTunisiaTurkeyTurkmenistanTurks and Caicos IslandsTuvaluUgandaUkraineUnited Arab EmiratesUnited KingdomUnited StatesUpper middle incomeUruguayUzbekistanVanuatuVenezuela, RBVietnamVirgin Islands (U.S.)West Bank and GazaWorldYemen, Rep.ZambiaZimbabwe La ligne de temps
Cette échelle de temps montre un graphique de 1961 année à 2016 année Iran, Islamic Rep.. Les données jusqu'à 1960 année ne sont pas présentés. Quantité d'observations actuelles selon dates: 56.
Source (désignation):
Les indicateurs du développement mondiale
Source (organisation):
World Bank Staff estimates based on United Nations, World Urbanization Prospects.
Catégories:
Climate Change, Urban Development
Dernière mise à jour
23 avr. 2017
Les indicateurs de changement de valeurs selon les années
Minimum:
7.39 mln.
1 janv. 1961
Maximum:
58.046 mln.
1 janv. 2016
Pour la date d''observation
Valeur
Changement absolu
Le changement par rapport à la valeur précédente
1 janv. 1961
7.39 mln.
+7.39 mln.
0.0%
1 janv. 1962
7.731 mln.
+340.498 milles
4.61%
1 janv. 1963
8.087 mln.
+355.974 milles
4.6%
1 janv. 1964
8.458 mln.
+371.411 milles
4.59%
1 janv. 1965
8.846 mln.
+387.776 milles
4.58%
1 janv. 1966
9.25 mln.
+404.409 milles
4.57%
1 janv. 1967
9.674 mln.
+423.456 milles
4.58%
1 janv. 1968
10.147 mln.
+473.658 milles
4.9%
1 janv. 1969
10.661 mln.
+513.506 milles
5.06%
1 janv. 1970
11.195 mln.
+534.24 milles
5.01%
1 janv. 1971
11.751 mln.
+555.972 milles
4.97%
1 janv. 1972
12.33 mln.
+579.09 milles
4.93%
1 janv. 1973
12.936 mln.
+605.68 milles
4.91%
1 janv. 1974
13.573 mln.
+636.882 milles
4.92%
1 janv. 1975
14.25 mln.
+676.959 milles
4.99%
1 janv. 1976
14.973 mln.
+723.442 milles
5.08%
1 janv. 1977
15.745 mln.
+771.503 milles
5.15%
1 janv. 1978
16.526 mln.
+781.565 milles
4.96%
1 janv. 1979
17.345 mln.
+818.481 milles
4.95%
1 janv. 1980
18.238 mln.
+892.766 milles
5.15%
1 janv. 1981
19.215 mln.
+977.838 milles
5.36%
1 janv. 1982
20.279 mln.
+1.064 mln.
5.54%
1 janv. 1983
21.423 mln.
+1.144 mln.
5.64%
1 janv. 1984
22.641 mln.
+1.218 mln.
5.68%
1 janv. 1985
23.922 mln.
+1.281 mln.
5.66%
1 janv. 1986
25.251 mln.
+1.329 mln.
5.56%
1 janv. 1987
26.636 mln.
+1.386 mln.
5.49%
1 janv. 1988
27.989 mln.
+1.352 mln.
5.08%
1 janv. 1989
29.306 mln.
+1.317 mln.
4.71%
1 janv. 1990
30.539 mln.
+1.233 mln.
4.21%
1 janv. 1991
31.64 mln.
+1.101 mln.
3.61%
1 janv. 1992
32.577 mln.
+936.735 milles
2.96%
1 janv. 1993
33.514 mln.
+936.903 milles
2.88%
1 janv. 1994
34.416 mln.
+902.365 milles
2.69%
1 janv. 1995
35.332 mln.
+915.756 milles
2.66%
1 janv. 1996
36.334 mln.
+1.002 mln.
2.84%
1 janv. 1997
37.45 mln.
+1.117 mln.
3.07%
1 janv. 1998
38.612 mln.
+1.162 mln.
3.1%
1 janv. 1999
39.816 mln.
+1.204 mln.
3.12%
1 janv. 2000
41.018 mln.
+1.202 mln.
3.02%
1 janv. 2001
42.172 mln.
+1.154 mln.
2.81%
1 janv. 2002
43.267 mln.
+1.095 mln.
2.6%
1 janv. 2003
44.32 mln.
+1.053 mln.
2.43%
1 janv. 2004
45.342 mln.
+1.023 mln.
2.31%
1 janv. 2005
46.355 mln.
+1.012 mln.
2.23%
1 janv. 2006
47.373 mln.
+1.018 mln.
2.2%
1 janv. 2007
48.397 mln.
+1.024 mln.
2.16%
1 janv. 2008
49.39 mln.
+992.594 milles
2.05%
1 janv. 2009
50.378 mln.
+988.517 milles
2.0%
1 janv. 2010
51.393 mln.
+1.014 mln.
2.01%
1 janv. 2011
52.442 mln.
+1.049 mln.
2.04%
1 janv. 2012
53.531 mln.
+1.089 mln.
2.08%
1 janv. 2013
54.657 mln.
+1.126 mln.
2.1%
1 janv. 2014
55.797 mln.
+1.14 mln.
2.08%
1 janv. 2015
56.932 mln.
+1.135 mln.
2.03%
1 janv. 2016
58.046 mln.
+1.115 mln.
1.96%
Classement des pays selon les statistiques actuelles par années


Commentaires: