29
/fr/
fr
AIzaSyAYiBZKx7MnpbEhh9jyipgxe19OcubqV5w
April 1, 2024
156873
Indonesia
IDN
true
2
1
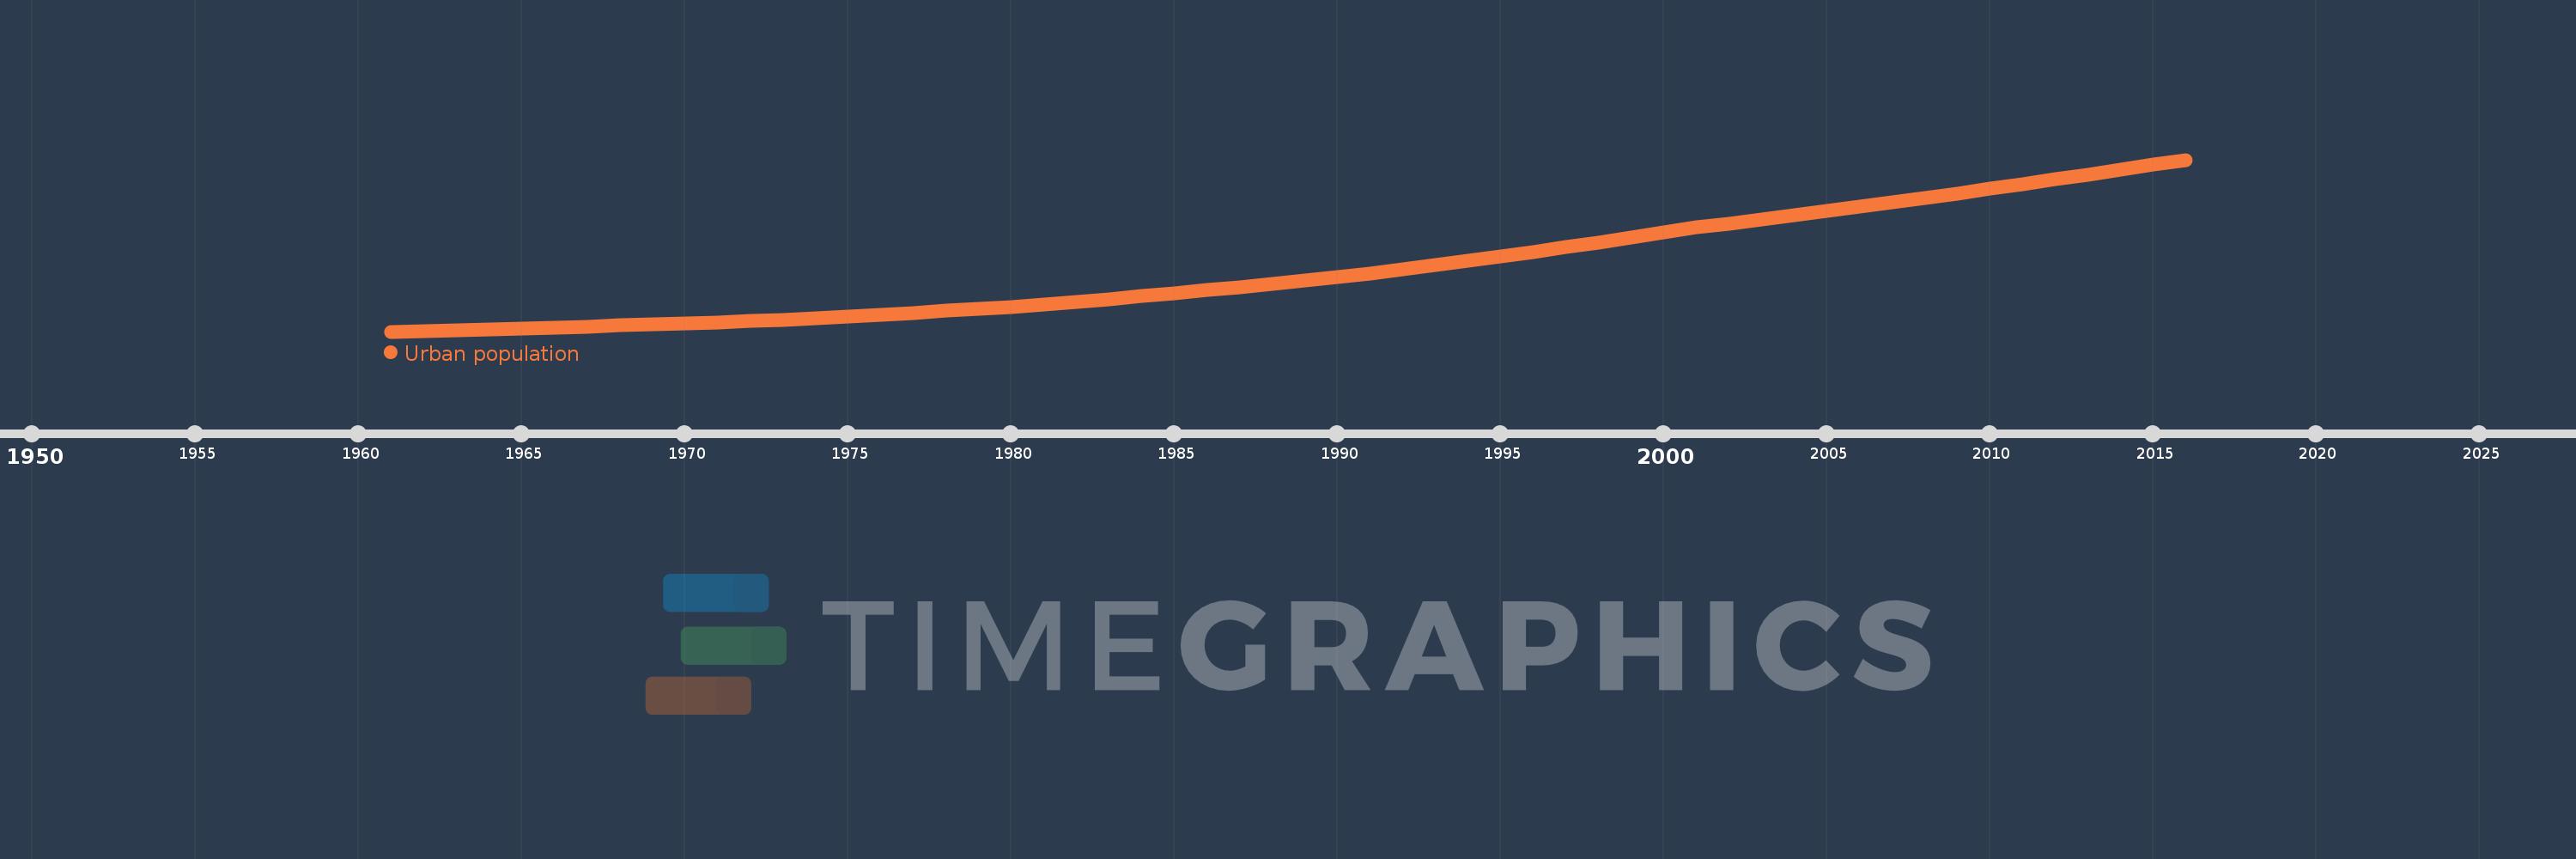
Urban population
2016,2015,2014,2013,2012,2011,2010,2009,2008,2007,2006,2005,2004,2003,2002,2001,2000,1999,1998,1997,1996,1995,1994,1993,1992,1991,1990,1989,1988,1987,1986,1985,1984,1983,1982,1981,1980,1979,1978,1977,1976,1975,1974,1973,1972,1971,1970,1969,1968,1967,1966,1965,1964,1963,1962,1961
Cette statistique dans les autres pays:
AfghanistanAlbaniaAlgeriaAmerican SamoaAndorraAngolaAntigua and BarbudaArab WorldArgentinaArmeniaArubaAustraliaAustriaAzerbaijanBahamas, TheBahrainBangladeshBarbadosBelarusBelgiumBelizeBeninBermudaBhutanBoliviaBosnia and HerzegovinaBotswanaBrazilBritish Virgin IslandsBrunei DarussalamBulgariaBurkina FasoBurundiCabo VerdeCambodiaCameroonCanadaCaribbean small statesCayman IslandsCentral African RepublicCentral Europe and the BalticsChadChannel IslandsChileChinaColombiaComorosCongo, Dem. Rep.Congo, Rep.Costa RicaCote d'IvoireCroatiaCubaCuracaoCyprusCzech RepublicDenmarkDjiboutiDominicaDominican RepublicEarly-demographic dividendEast Asia & PacificEast Asia & Pacific (excluding high income)East Asia & Pacific (IDA & IBRD countries)EcuadorEgypt, Arab Rep.El SalvadorEquatorial GuineaEritreaEstoniaEthiopiaEuro areaEurope & Central AsiaEurope & Central Asia (excluding high income)Europe & Central Asia (IDA & IBRD countries)European UnionFaroe IslandsFijiFinlandFragile and conflict affected situationsFranceFrench PolynesiaGabonGambia, TheGeorgiaGermanyGhanaGibraltarGreeceGreenlandGrenadaGuamGuatemalaGuineaGuinea-BissauGuyanaHaitiHeavily indebted poor countries (HIPC)High incomeHondurasHong Kong SAR, ChinaHungaryIBRD onlyIcelandIDA & IBRD totalIDA blendIDA onlyIDA totalIndiaIndonesiaIran, Islamic Rep.IraqIrelandIsle of ManIsraelItalyJamaicaJapanJordanKazakhstanKenyaKiribatiKorea, Dem. People’s Rep.Korea, Rep.KuwaitKyrgyz RepublicLao PDRLate-demographic dividendLatin America & Caribbean Latin America & Caribbean (excluding high income)Latin America & the Caribbean (IDA & IBRD countries)LatviaLeast developed countries: UN classificationLebanonLesothoLiberiaLibyaLiechtensteinLithuaniaLow & middle incomeLow incomeLower middle incomeLuxembourgMacao SAR, ChinaMacedonia, FYRMadagascarMalawiMalaysiaMaldivesMaliMaltaMarshall IslandsMauritaniaMauritiusMexicoMicronesia, Fed. Sts.Middle East & North AfricaMiddle East & North Africa (excluding high income)Middle East & North Africa (IDA & IBRD countries)Middle incomeMoldovaMonacoMongoliaMontenegroMoroccoMozambiqueMyanmarNamibiaNauruNepalNetherlandsNew CaledoniaNew ZealandNicaraguaNigerNigeriaNorth AmericaNorthern Mariana IslandsNorwayOECD membersOmanOther small statesPacific island small statesPakistanPalauPanamaPapua New GuineaParaguayPeruPhilippinesPolandPortugalPost-demographic dividendPre-demographic dividendPuerto RicoQatarRomaniaRussian FederationRwandaSamoaSan MarinoSao Tome and PrincipeSaudi ArabiaSenegalSerbiaSeychellesSierra LeoneSingaporeSint Maarten (Dutch part)Slovak RepublicSloveniaSmall statesSolomon IslandsSomaliaSouth AfricaSouth AsiaSouth Asia (IDA & IBRD)South SudanSpainSri LankaSt. Kitts and NevisSt. LuciaSt. Vincent and the GrenadinesSub-Saharan Africa Sub-Saharan Africa (excluding high income)Sub-Saharan Africa (IDA & IBRD countries)SudanSurinameSwazilandSwedenSwitzerlandSyrian Arab RepublicTajikistanTanzaniaThailandTimor-LesteTogoTongaTrinidad and TobagoTunisiaTurkeyTurkmenistanTurks and Caicos IslandsTuvaluUgandaUkraineUnited Arab EmiratesUnited KingdomUnited StatesUpper middle incomeUruguayUzbekistanVanuatuVenezuela, RBVietnamVirgin Islands (U.S.)West Bank and GazaWorldYemen, Rep.ZambiaZimbabwe La ligne de temps
Cette échelle de temps montre un graphique de 1961 année à 2016 année Indonesia. Les données jusqu'à 1960 année ne sont pas présentés. Quantité d'observations actuelles selon dates: 56.
Source (désignation):
Les indicateurs du développement mondiale
Source (organisation):
World Bank Staff estimates based on United Nations, World Urbanization Prospects.
Catégories:
Climate Change, Urban Development
Dernière mise à jour
23 avr. 2017
Les indicateurs de changement de valeurs selon les années
Minimum:
12.805 mln.
1 janv. 1961
Maximum:
138.42 mln.
1 janv. 2016
Pour la date d''observation
Valeur
Changement absolu
Le changement par rapport à la valeur précédente
1 janv. 1961
12.805 mln.
+12.805 mln.
0.0%
1 janv. 1962
13.359 mln.
+553.972 milles
4.33%
1 janv. 1963
13.937 mln.
+577.997 milles
4.33%
1 janv. 1964
14.543 mln.
+605.182 milles
4.34%
1 janv. 1965
15.176 mln.
+633.312 milles
4.35%
1 janv. 1966
15.838 mln.
+661.893 milles
4.36%
1 janv. 1967
16.531 mln.
+693.201 milles
4.38%
1 janv. 1968
17.255 mln.
+724.52 milles
4.38%
1 janv. 1969
18.009 mln.
+753.388 milles
4.37%
1 janv. 1970
18.792 mln.
+783.596 milles
4.35%
1 janv. 1971
19.603 mln.
+810.968 milles
4.32%
1 janv. 1972
20.445 mln.
+841.87 milles
4.29%
1 janv. 1973
21.523 mln.
+1.078 mln.
5.27%
1 janv. 1974
22.711 mln.
+1.188 mln.
5.52%
1 janv. 1975
23.955 mln.
+1.243 mln.
5.47%
1 janv. 1976
25.252 mln.
+1.297 mln.
5.42%
1 janv. 1977
26.605 mln.
+1.353 mln.
5.36%
1 janv. 1978
28.011 mln.
+1.406 mln.
5.28%
1 janv. 1979
29.478 mln.
+1.467 mln.
5.24%
1 janv. 1980
31.006 mln.
+1.528 mln.
5.18%
1 janv. 1981
32.601 mln.
+1.595 mln.
5.14%
1 janv. 1982
34.446 mln.
+1.845 mln.
5.66%
1 janv. 1983
36.473 mln.
+2.027 mln.
5.88%
1 janv. 1984
38.587 mln.
+2.114 mln.
5.8%
1 janv. 1985
40.783 mln.
+2.197 mln.
5.69%
1 janv. 1986
43.05 mln.
+2.267 mln.
5.56%
1 janv. 1987
45.389 mln.
+2.339 mln.
5.43%
1 janv. 1988
47.801 mln.
+2.411 mln.
5.31%
1 janv. 1989
50.288 mln.
+2.488 mln.
5.2%
1 janv. 1990
52.848 mln.
+2.56 mln.
5.09%
1 janv. 1991
55.491 mln.
+2.643 mln.
5.0%
1 janv. 1992
58.362 mln.
+2.872 mln.
5.17%
1 janv. 1993
61.404 mln.
+3.042 mln.
5.21%
1 janv. 1994
64.53 mln.
+3.127 mln.
5.09%
1 janv. 1995
67.749 mln.
+3.219 mln.
4.99%
1 janv. 1996
71.055 mln.
+3.305 mln.
4.88%
1 janv. 1997
74.443 mln.
+3.388 mln.
4.77%
1 janv. 1998
77.908 mln.
+3.465 mln.
4.66%
1 janv. 1999
81.464 mln.
+3.556 mln.
4.56%
1 janv. 2000
85.11 mln.
+3.646 mln.
4.48%
1 janv. 2001
88.851 mln.
+3.741 mln.
4.4%
1 janv. 2002
91.745 mln.
+2.894 mln.
3.26%
1 janv. 2003
94.699 mln.
+2.954 mln.
3.22%
1 janv. 2004
97.713 mln.
+3.014 mln.
3.18%
1 janv. 2005
100.795 mln.
+3.081 mln.
3.15%
1 janv. 2006
103.935 mln.
+3.14 mln.
3.12%
1 janv. 2007
107.14 mln.
+3.205 mln.
3.08%
1 janv. 2008
110.406 mln.
+3.266 mln.
3.05%
1 janv. 2009
113.743 mln.
+3.337 mln.
3.02%
1 janv. 2010
117.144 mln.
+3.401 mln.
2.99%
1 janv. 2011
120.623 mln.
+3.479 mln.
2.97%
1 janv. 2012
124.147 mln.
+3.524 mln.
2.92%
1 janv. 2013
127.71 mln.
+3.563 mln.
2.87%
1 janv. 2014
131.293 mln.
+3.583 mln.
2.81%
1 janv. 2015
134.869 mln.
+3.576 mln.
2.72%
1 janv. 2016
138.42 mln.
+3.551 mln.
2.63%
Classement des pays selon les statistiques actuelles par années


Commentaires: