29
/fr/
fr
AIzaSyAYiBZKx7MnpbEhh9jyipgxe19OcubqV5w
April 1, 2024
48589
Middle East & North Africa
MEA
false
2
1
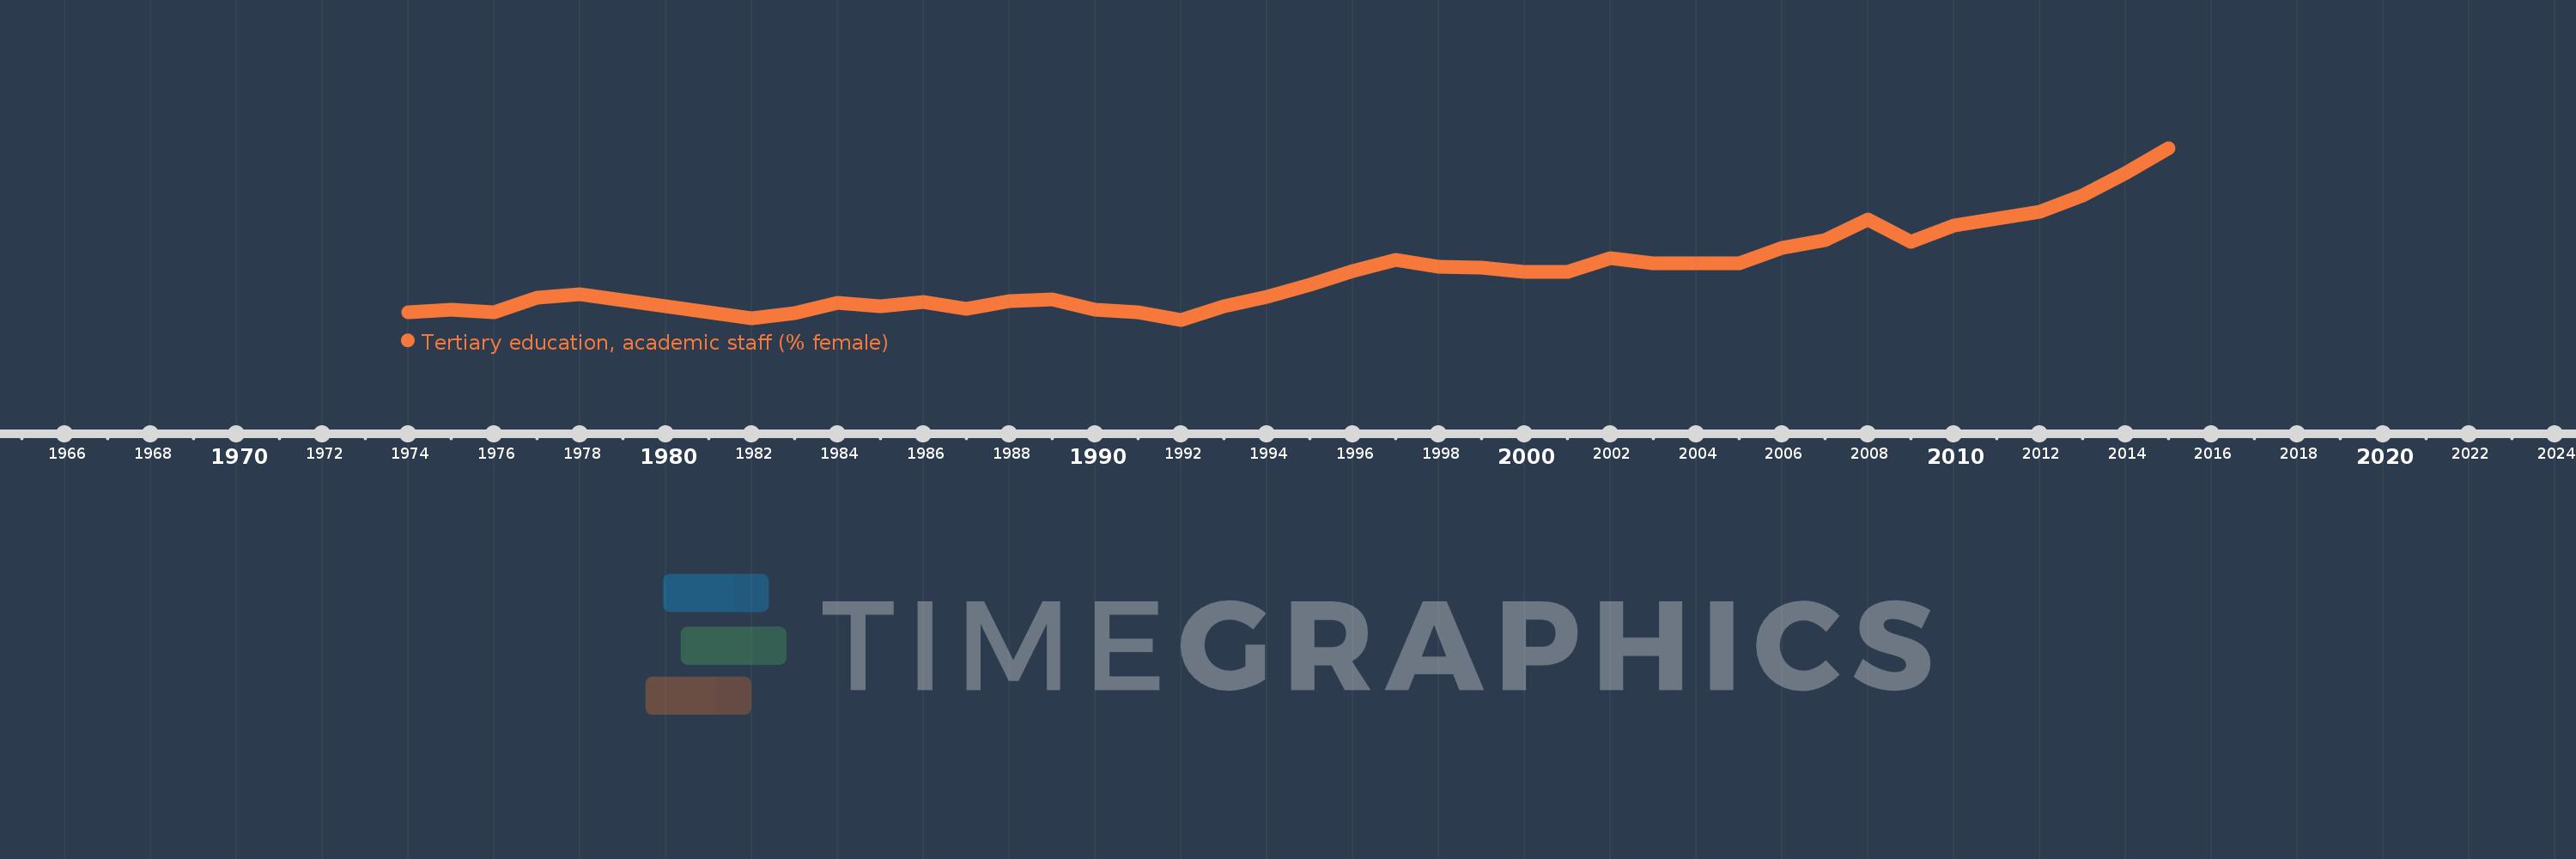
Tertiary education, academic staff (% female)
2015,2014,2013,2012,2011,2010,2009,2008,2007,2006,2005,2004,2003,2002,2001,2000,1999,1998,1997,1996,1995,1994,1993,1992,1991,1990,1989,1988,1987,1986,1985,1984,1983,1982,1978,1977,1976,1975,1974
Cette statistique dans les autres pays:
AfghanistanAlbaniaAlgeriaAndorraAngolaAntigua and BarbudaArab WorldArgentinaArmeniaArubaAustraliaAustriaAzerbaijanBahamas, TheBahrainBangladeshBarbadosBelarusBelgiumBelizeBeninBermudaBhutanBoliviaBosnia and HerzegovinaBotswanaBrazilBritish Virgin IslandsBrunei DarussalamBulgariaBurkina FasoBurundiCabo VerdeCambodiaCameroonCanadaCaribbean small statesCayman IslandsCentral African RepublicCentral Europe and the BalticsChadChileChinaColombiaComorosCongo, Dem. Rep.Congo, Rep.Costa RicaCote d'IvoireCroatiaCubaCyprusCzech RepublicDenmarkDjiboutiDominicaDominican RepublicEarly-demographic dividendEast Asia & PacificEast Asia & Pacific (excluding high income)East Asia & Pacific (IDA & IBRD countries)EcuadorEgypt, Arab Rep.El SalvadorEquatorial GuineaEritreaEstoniaEthiopiaEuro areaEurope & Central AsiaEurope & Central Asia (excluding high income)Europe & Central Asia (IDA & IBRD countries)European UnionFijiFinlandFragile and conflict affected situationsFranceGabonGambia, TheGeorgiaGermanyGhanaGreeceGrenadaGuineaGuyanaHaitiHeavily indebted poor countries (HIPC)High incomeHondurasHong Kong SAR, ChinaHungaryIBRD onlyIcelandIDA & IBRD totalIDA blendIDA onlyIDA totalIndiaIndonesiaIran, Islamic Rep.IraqIrelandItalyJamaicaJapanJordanKazakhstanKorea, Dem. People’s Rep.Korea, Rep.KuwaitKyrgyz RepublicLao PDRLate-demographic dividendLatin America & Caribbean Latin America & Caribbean (excluding high income)Latin America & the Caribbean (IDA & IBRD countries)LatviaLeast developed countries: UN classificationLebanonLesothoLiberiaLibyaLiechtensteinLithuaniaLow & middle incomeLow incomeLower middle incomeLuxembourgMacao SAR, ChinaMacedonia, FYRMadagascarMalawiMalaysiaMaldivesMaliMaltaMarshall IslandsMauritaniaMauritiusMicronesia, Fed. Sts.Middle East & North AfricaMiddle East & North Africa (excluding high income)Middle East & North Africa (IDA & IBRD countries)Middle incomeMoldovaMongoliaMoroccoMozambiqueMyanmarNamibiaNepalNetherlandsNew ZealandNicaraguaNigerNigeriaNorth AmericaNorwayOECD membersOmanOther small statesPacific island small statesPakistanPalauPanamaPapua New GuineaPeruPhilippinesPolandPortugalPost-demographic dividendPre-demographic dividendPuerto RicoQatarRomaniaRussian FederationRwandaSamoaSao Tome and PrincipeSaudi ArabiaSenegalSerbiaSeychellesSierra LeoneSingaporeSint Maarten (Dutch part)Slovak RepublicSloveniaSmall statesSomaliaSouth AfricaSouth AsiaSouth Asia (IDA & IBRD)SpainSri LankaSt. Kitts and NevisSt. LuciaSt. Vincent and the GrenadinesSub-Saharan Africa Sub-Saharan Africa (excluding high income)Sub-Saharan Africa (IDA & IBRD countries)SudanSurinameSwazilandSwedenSwitzerlandSyrian Arab RepublicTajikistanTanzaniaThailandTimor-LesteTogoTongaTrinidad and TobagoTunisiaTurkeyTurkmenistanUgandaUnited Arab EmiratesUnited KingdomUnited StatesUpper middle incomeUruguayUzbekistanVenezuela, RBVietnamWest Bank and GazaWorldYemen, Rep.Zimbabwe La ligne de temps
Cette échelle de temps montre un graphique de 1974 année à 2015 année Middle East & North Africa. Les données jusqu'à 1973 année ne sont pas présentés. Quantité d'observations actuelles selon dates: 39.
Source (désignation):
Les indicateurs du développement mondiale
Source (organisation):
United Nations Educational, Scientific, and Cultural Organization (UNESCO) Institute for Statistics.
Catégories:
Education
Dernière mise à jour
23 avr. 2017
Les indicateurs de changement de valeurs selon les années
Minimum:
26.512
1 janv. 1992
Maximum:
35.107
1 janv. 2015
Pour la date d''observation
Valeur
Changement absolu
Le changement par rapport à la valeur précédente
1 janv. 1974
26.868
+26.868
0.0%
1 janv. 1975
27.025
+0.156
0.58%
1 janv. 1976
26.898
-0.127
-0.47%
1 janv. 1977
27.629
+0.731
2.72%
1 janv. 1978
27.776
+0.147
0.53%
1 janv. 1982
26.584
-1.192
-4.29%
1 janv. 1983
26.844
+0.26
0.98%
1 janv. 1984
27.378
+0.534
1.99%
1 janv. 1985
27.172
-0.206
-0.75%
1 janv. 1986
27.406
+0.234
0.86%
1 janv. 1987
27.045
-0.361
-1.32%
1 janv. 1988
27.452
+0.406
1.5%
1 janv. 1989
27.528
+0.076
0.28%
1 janv. 1990
27.008
-0.52
-1.89%
1 janv. 1991
26.874
-0.134
-0.5%
1 janv. 1992
26.512
-0.362
-1.35%
1 janv. 1993
27.166
+0.654
2.47%
1 janv. 1994
27.674
+0.508
1.87%
1 janv. 1995
28.266
+0.592
2.14%
1 janv. 1996
28.932
+0.665
2.35%
1 janv. 1997
29.504
+0.572
1.98%
1 janv. 1998
29.174
-0.33
-1.12%
1 janv. 1999
29.14
-0.034
-0.12%
1 janv. 2000
28.926
-0.213
-0.73%
1 janv. 2001
28.896
-0.03
-0.1%
1 janv. 2002
29.587
+0.691
2.39%
1 janv. 2003
29.338
-0.248
-0.84%
1 janv. 2004
29.353
+0.015
0.05%
1 janv. 2005
29.315
-0.038
-0.13%
1 janv. 2006
30.124
+0.808
2.76%
1 janv. 2007
30.481
+0.358
1.19%
1 janv. 2008
31.509
+1.027
3.37%
1 janv. 2009
30.425
-1.084
-3.44%
1 janv. 2010
31.214
+0.789
2.59%
1 janv. 2011
31.586
+0.373
1.19%
1 janv. 2012
31.906
+0.319
1.01%
1 janv. 2013
32.733
+0.827
2.59%
1 janv. 2014
33.863
+1.13
3.45%
1 janv. 2015
35.107
+1.245
3.68%
Classement des pays selon les statistiques actuelles par années


Commentaires: