29
/fr/
fr
AIzaSyAYiBZKx7MnpbEhh9jyipgxe19OcubqV5w
April 1, 2024
38625
IDA blend
IDB
false
2
1
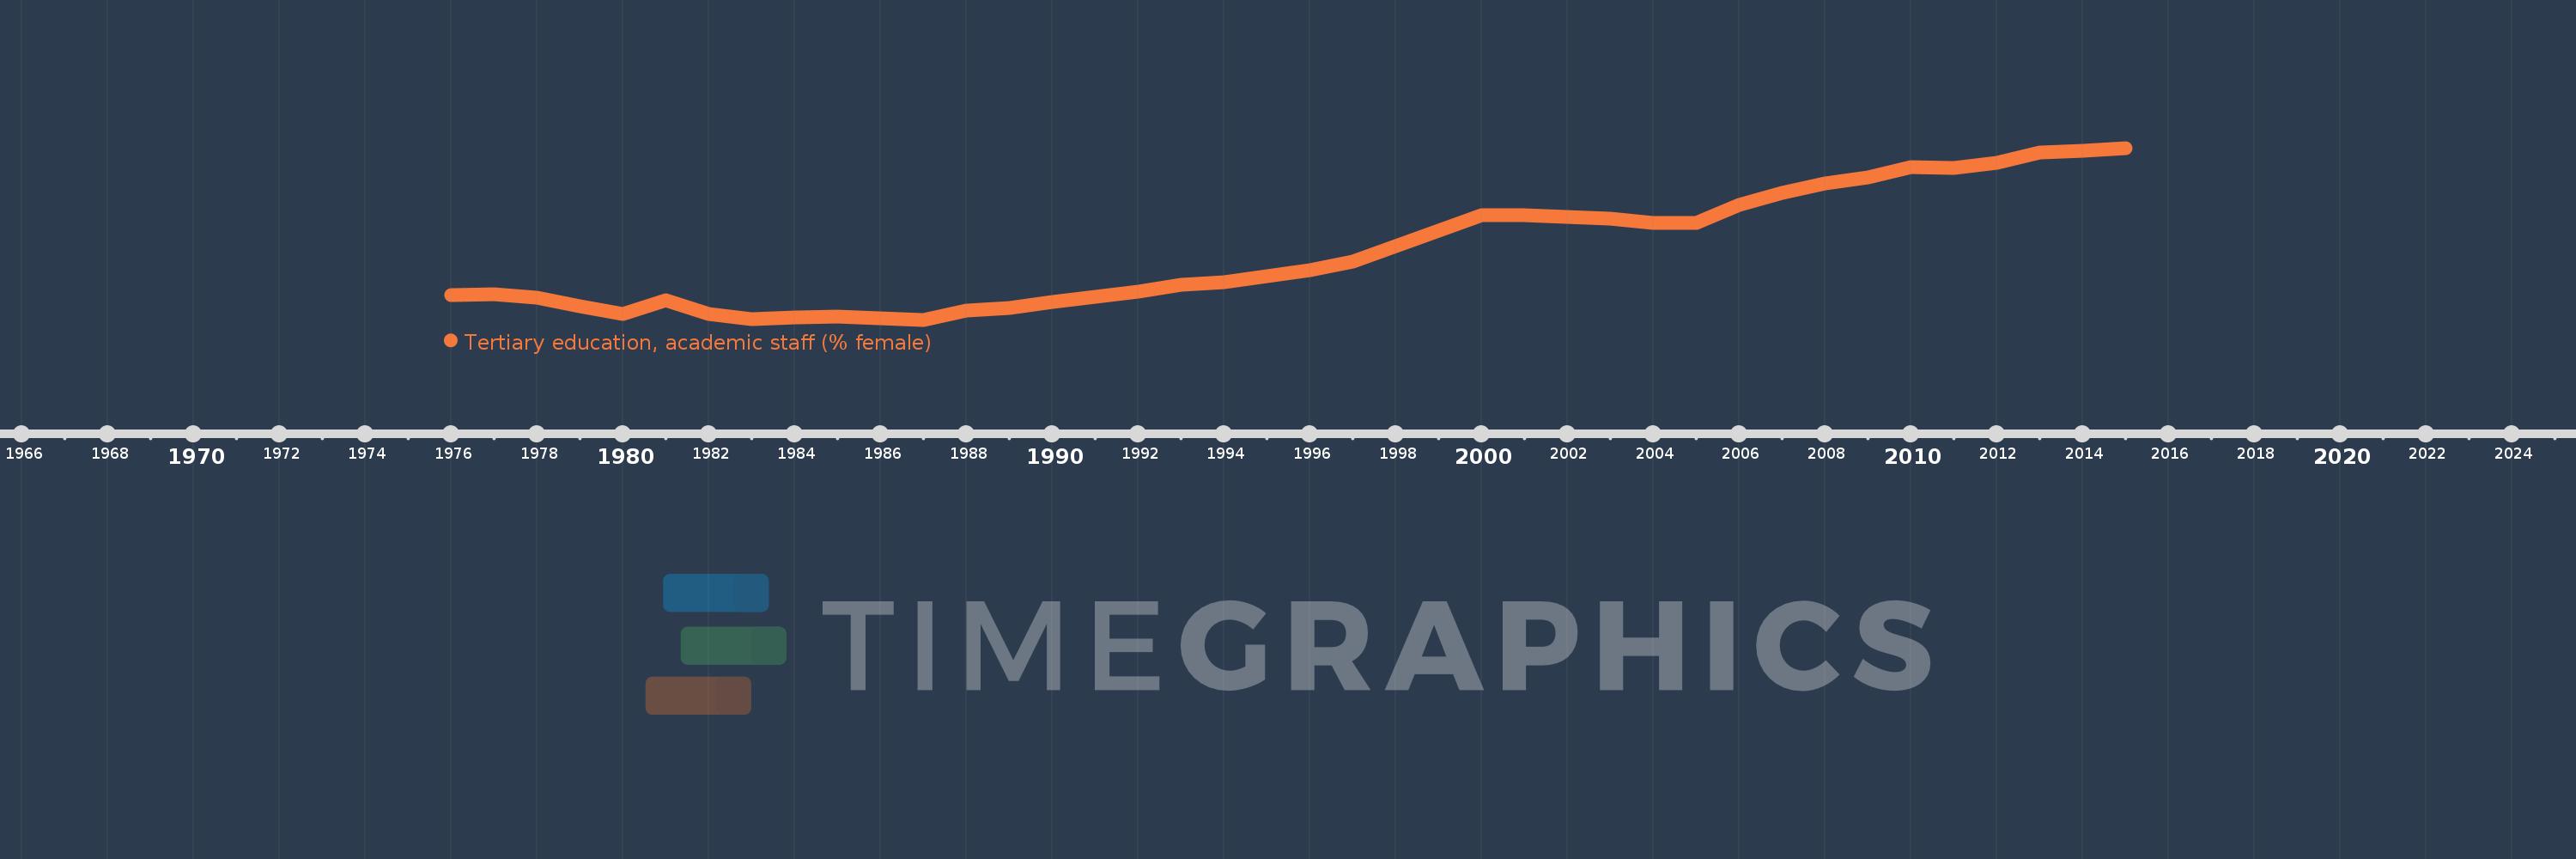
Tertiary education, academic staff (% female)
2015,2014,2013,2012,2011,2010,2009,2008,2007,2006,2005,2004,2003,2002,2001,2000,1999,1998,1997,1996,1995,1994,1993,1992,1991,1990,1989,1988,1987,1986,1985,1984,1983,1982,1981,1980,1979,1978,1977,1976
Cette statistique dans les autres pays:
AfghanistanAlbaniaAlgeriaAndorraAngolaAntigua and BarbudaArab WorldArgentinaArmeniaArubaAustraliaAustriaAzerbaijanBahamas, TheBahrainBangladeshBarbadosBelarusBelgiumBelizeBeninBermudaBhutanBoliviaBosnia and HerzegovinaBotswanaBrazilBritish Virgin IslandsBrunei DarussalamBulgariaBurkina FasoBurundiCabo VerdeCambodiaCameroonCanadaCaribbean small statesCayman IslandsCentral African RepublicCentral Europe and the BalticsChadChileChinaColombiaComorosCongo, Dem. Rep.Congo, Rep.Costa RicaCote d'IvoireCroatiaCubaCyprusCzech RepublicDenmarkDjiboutiDominicaDominican RepublicEarly-demographic dividendEast Asia & PacificEast Asia & Pacific (excluding high income)East Asia & Pacific (IDA & IBRD countries)EcuadorEgypt, Arab Rep.El SalvadorEquatorial GuineaEritreaEstoniaEthiopiaEuro areaEurope & Central AsiaEurope & Central Asia (excluding high income)Europe & Central Asia (IDA & IBRD countries)European UnionFijiFinlandFragile and conflict affected situationsFranceGabonGambia, TheGeorgiaGermanyGhanaGreeceGrenadaGuineaGuyanaHaitiHeavily indebted poor countries (HIPC)High incomeHondurasHong Kong SAR, ChinaHungaryIBRD onlyIcelandIDA & IBRD totalIDA blendIDA onlyIDA totalIndiaIndonesiaIran, Islamic Rep.IraqIrelandItalyJamaicaJapanJordanKazakhstanKorea, Dem. People’s Rep.Korea, Rep.KuwaitKyrgyz RepublicLao PDRLate-demographic dividendLatin America & Caribbean Latin America & Caribbean (excluding high income)Latin America & the Caribbean (IDA & IBRD countries)LatviaLeast developed countries: UN classificationLebanonLesothoLiberiaLibyaLiechtensteinLithuaniaLow & middle incomeLow incomeLower middle incomeLuxembourgMacao SAR, ChinaMacedonia, FYRMadagascarMalawiMalaysiaMaldivesMaliMaltaMarshall IslandsMauritaniaMauritiusMicronesia, Fed. Sts.Middle East & North AfricaMiddle East & North Africa (excluding high income)Middle East & North Africa (IDA & IBRD countries)Middle incomeMoldovaMongoliaMoroccoMozambiqueMyanmarNamibiaNepalNetherlandsNew ZealandNicaraguaNigerNigeriaNorth AmericaNorwayOECD membersOmanOther small statesPacific island small statesPakistanPalauPanamaPapua New GuineaPeruPhilippinesPolandPortugalPost-demographic dividendPre-demographic dividendPuerto RicoQatarRomaniaRussian FederationRwandaSamoaSao Tome and PrincipeSaudi ArabiaSenegalSerbiaSeychellesSierra LeoneSingaporeSint Maarten (Dutch part)Slovak RepublicSloveniaSmall statesSomaliaSouth AfricaSouth AsiaSouth Asia (IDA & IBRD)SpainSri LankaSt. Kitts and NevisSt. LuciaSt. Vincent and the GrenadinesSub-Saharan Africa Sub-Saharan Africa (excluding high income)Sub-Saharan Africa (IDA & IBRD countries)SudanSurinameSwazilandSwedenSwitzerlandSyrian Arab RepublicTajikistanTanzaniaThailandTimor-LesteTogoTongaTrinidad and TobagoTunisiaTurkeyTurkmenistanUgandaUnited Arab EmiratesUnited KingdomUnited StatesUpper middle incomeUruguayUzbekistanVenezuela, RBVietnamWest Bank and GazaWorldYemen, Rep.Zimbabwe La ligne de temps
Cette échelle de temps montre un graphique de 1976 année à 2015 année IDA blend. Les données jusqu'à 1975 année ne sont pas présentés. Quantité d'observations actuelles selon dates: 40.
Source (désignation):
Les indicateurs du développement mondiale
Source (organisation):
United Nations Educational, Scientific, and Cultural Organization (UNESCO) Institute for Statistics.
Catégories:
Education
Dernière mise à jour
23 avr. 2017
Les indicateurs de changement de valeurs selon les années
Minimum:
26.695
1 janv. 1987
Maximum:
37.647
1 janv. 2015
Pour la date d''observation
Valeur
Changement absolu
Le changement par rapport à la valeur précédente
1 janv. 1976
28.271
+28.271
0.0%
1 janv. 1977
28.311
+0.04
0.14%
1 janv. 1978
28.089
-0.223
-0.79%
1 janv. 1979
27.564
-0.525
-1.87%
1 janv. 1980
27.081
-0.483
-1.75%
1 janv. 1981
27.934
+0.853
3.15%
1 janv. 1982
27.053
-0.881
-3.15%
1 janv. 1983
26.711
-0.342
-1.26%
1 janv. 1984
26.856
+0.145
0.54%
1 janv. 1985
26.891
+0.035
0.13%
1 janv. 1986
26.78
-0.111
-0.41%
1 janv. 1987
26.695
-0.085
-0.32%
1 janv. 1988
27.268
+0.573
2.15%
1 janv. 1989
27.439
+0.171
0.63%
1 janv. 1990
27.834
+0.395
1.44%
1 janv. 1991
28.146
+0.311
1.12%
1 janv. 1992
28.459
+0.313
1.11%
1 janv. 1993
28.936
+0.476
1.67%
1 janv. 1994
29.09
+0.155
0.53%
1 janv. 1995
29.453
+0.363
1.25%
1 janv. 1996
29.872
+0.42
1.42%
1 janv. 1997
30.376
+0.504
1.69%
1 janv. 1998
31.402
+1.025
3.37%
1 janv. 1999
32.374
+0.973
3.1%
1 janv. 2000
33.359
+0.985
3.04%
1 janv. 2001
33.356
-0.004
-0.01%
1 janv. 2002
33.229
-0.127
-0.38%
1 janv. 2003
33.13
-0.099
-0.3%
1 janv. 2004
32.886
-0.243
-0.73%
1 janv. 2005
32.883
-0.003
-0.01%
1 janv. 2006
34.043
+1.16
3.53%
1 janv. 2007
34.775
+0.732
2.15%
1 janv. 2008
35.4
+0.625
1.8%
1 janv. 2009
35.755
+0.355
1.0%
1 janv. 2010
36.445
+0.69
1.93%
1 janv. 2011
36.376
-0.069
-0.19%
1 janv. 2012
36.684
+0.308
0.85%
1 janv. 2013
37.339
+0.655
1.79%
1 janv. 2014
37.458
+0.118
0.32%
1 janv. 2015
37.647
+0.19
0.51%
Classement des pays selon les statistiques actuelles par années


Commentaires: