29
/fr/
fr
AIzaSyAYiBZKx7MnpbEhh9jyipgxe19OcubqV5w
April 1, 2024
27747
East Asia & Pacific
EAS
false
2
1
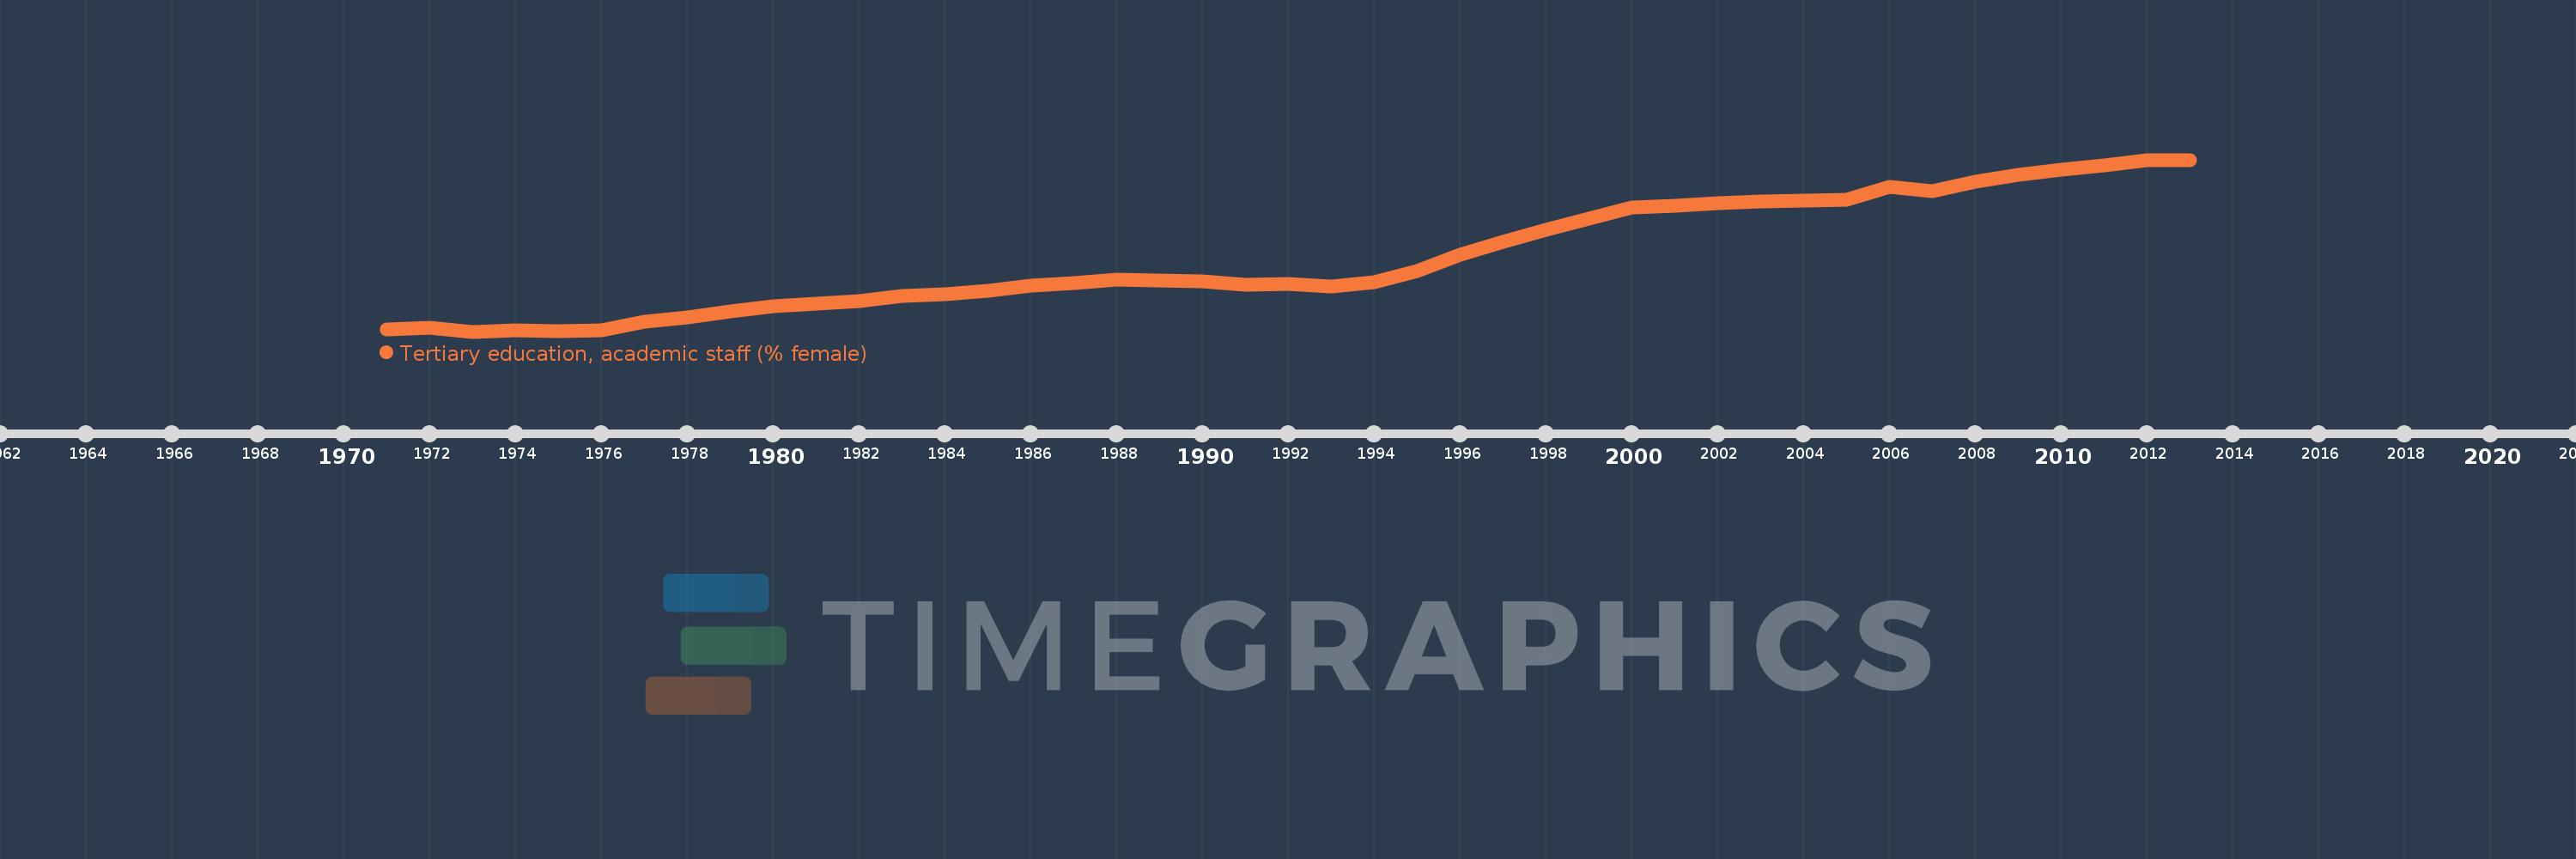
Tertiary education, academic staff (% female)
2013,2012,2011,2010,2009,2008,2007,2006,2005,2004,2003,2002,2001,2000,1999,1998,1997,1996,1995,1994,1993,1992,1991,1990,1989,1988,1987,1986,1985,1984,1983,1982,1981,1980,1979,1978,1977,1976,1975,1974,1973,1972,1971
Cette statistique dans les autres pays:
AfghanistanAlbaniaAlgeriaAndorraAngolaAntigua and BarbudaArab WorldArgentinaArmeniaArubaAustraliaAustriaAzerbaijanBahamas, TheBahrainBangladeshBarbadosBelarusBelgiumBelizeBeninBermudaBhutanBoliviaBosnia and HerzegovinaBotswanaBrazilBritish Virgin IslandsBrunei DarussalamBulgariaBurkina FasoBurundiCabo VerdeCambodiaCameroonCanadaCaribbean small statesCayman IslandsCentral African RepublicCentral Europe and the BalticsChadChileChinaColombiaComorosCongo, Dem. Rep.Congo, Rep.Costa RicaCote d'IvoireCroatiaCubaCyprusCzech RepublicDenmarkDjiboutiDominicaDominican RepublicEarly-demographic dividendEast Asia & PacificEast Asia & Pacific (excluding high income)East Asia & Pacific (IDA & IBRD countries)EcuadorEgypt, Arab Rep.El SalvadorEquatorial GuineaEritreaEstoniaEthiopiaEuro areaEurope & Central AsiaEurope & Central Asia (excluding high income)Europe & Central Asia (IDA & IBRD countries)European UnionFijiFinlandFragile and conflict affected situationsFranceGabonGambia, TheGeorgiaGermanyGhanaGreeceGrenadaGuineaGuyanaHaitiHeavily indebted poor countries (HIPC)High incomeHondurasHong Kong SAR, ChinaHungaryIBRD onlyIcelandIDA & IBRD totalIDA blendIDA onlyIDA totalIndiaIndonesiaIran, Islamic Rep.IraqIrelandItalyJamaicaJapanJordanKazakhstanKorea, Dem. People’s Rep.Korea, Rep.KuwaitKyrgyz RepublicLao PDRLate-demographic dividendLatin America & Caribbean Latin America & Caribbean (excluding high income)Latin America & the Caribbean (IDA & IBRD countries)LatviaLeast developed countries: UN classificationLebanonLesothoLiberiaLibyaLiechtensteinLithuaniaLow & middle incomeLow incomeLower middle incomeLuxembourgMacao SAR, ChinaMacedonia, FYRMadagascarMalawiMalaysiaMaldivesMaliMaltaMarshall IslandsMauritaniaMauritiusMicronesia, Fed. Sts.Middle East & North AfricaMiddle East & North Africa (excluding high income)Middle East & North Africa (IDA & IBRD countries)Middle incomeMoldovaMongoliaMoroccoMozambiqueMyanmarNamibiaNepalNetherlandsNew ZealandNicaraguaNigerNigeriaNorth AmericaNorwayOECD membersOmanOther small statesPacific island small statesPakistanPalauPanamaPapua New GuineaPeruPhilippinesPolandPortugalPost-demographic dividendPre-demographic dividendPuerto RicoQatarRomaniaRussian FederationRwandaSamoaSao Tome and PrincipeSaudi ArabiaSenegalSerbiaSeychellesSierra LeoneSingaporeSint Maarten (Dutch part)Slovak RepublicSloveniaSmall statesSomaliaSouth AfricaSouth AsiaSouth Asia (IDA & IBRD)SpainSri LankaSt. Kitts and NevisSt. LuciaSt. Vincent and the GrenadinesSub-Saharan Africa Sub-Saharan Africa (excluding high income)Sub-Saharan Africa (IDA & IBRD countries)SudanSurinameSwazilandSwedenSwitzerlandSyrian Arab RepublicTajikistanTanzaniaThailandTimor-LesteTogoTongaTrinidad and TobagoTunisiaTurkeyTurkmenistanUgandaUnited Arab EmiratesUnited KingdomUnited StatesUpper middle incomeUruguayUzbekistanVenezuela, RBVietnamWest Bank and GazaWorldYemen, Rep.Zimbabwe La ligne de temps
Cette échelle de temps montre un graphique de 1971 année à 2013 année East Asia & Pacific. Les données jusqu'à 1970 année ne sont pas présentés. Quantité d'observations actuelles selon dates: 43.
Source (désignation):
Les indicateurs du développement mondiale
Source (organisation):
United Nations Educational, Scientific, and Cultural Organization (UNESCO) Institute for Statistics.
Catégories:
Education
Dernière mise à jour
23 avr. 2017
Les indicateurs de changement de valeurs selon les années
Minimum:
20.243
1 janv. 1973
Maximum:
40.648
1 janv. 2012
Pour la date d''observation
Valeur
Changement absolu
Le changement par rapport à la valeur précédente
1 janv. 1971
20.48
+20.48
0.0%
1 janv. 1972
20.658
+0.178
0.87%
1 janv. 1973
20.243
-0.415
-2.01%
1 janv. 1974
20.349
+0.106
0.52%
1 janv. 1975
20.285
-0.065
-0.32%
1 janv. 1976
20.412
+0.127
0.63%
1 janv. 1977
21.462
+1.05
5.15%
1 janv. 1978
21.932
+0.47
2.19%
1 janv. 1979
22.634
+0.703
3.2%
1 janv. 1980
23.236
+0.602
2.66%
1 janv. 1981
23.557
+0.32
1.38%
1 janv. 1982
23.889
+0.333
1.41%
1 janv. 1983
24.518
+0.629
2.63%
1 janv. 1984
24.699
+0.181
0.74%
1 janv. 1985
25.065
+0.367
1.48%
1 janv. 1986
25.675
+0.61
2.43%
1 janv. 1987
26.019
+0.344
1.34%
1 janv. 1988
26.461
+0.443
1.7%
1 janv. 1989
26.268
-0.193
-0.73%
1 janv. 1990
26.192
-0.076
-0.29%
1 janv. 1991
25.791
-0.401
-1.53%
1 janv. 1992
25.884
+0.093
0.36%
1 janv. 1993
25.628
-0.256
-0.99%
1 janv. 1994
26.101
+0.474
1.85%
1 janv. 1995
27.471
+1.369
5.25%
1 janv. 1996
29.337
+1.867
6.8%
1 janv. 1997
30.93
+1.593
5.43%
1 janv. 1998
32.339
+1.409
4.55%
1 janv. 1999
33.682
+1.343
4.15%
1 janv. 2000
35.036
+1.355
4.02%
1 janv. 2001
35.202
+0.166
0.47%
1 janv. 2002
35.504
+0.302
0.86%
1 janv. 2003
35.682
+0.178
0.5%
1 janv. 2004
35.79
+0.108
0.3%
1 janv. 2005
35.93
+0.14
0.39%
1 janv. 2006
37.465
+1.535
4.27%
1 janv. 2007
36.946
-0.519
-1.38%
1 janv. 2008
38.005
+1.058
2.86%
1 janv. 2009
38.853
+0.848
2.23%
1 janv. 2010
39.456
+0.603
1.55%
1 janv. 2011
39.994
+0.538
1.36%
1 janv. 2012
40.648
+0.654
1.64%
1 janv. 2013
40.548
-0.1
-0.25%
Classement des pays selon les statistiques actuelles par années


Commentaires: