29
/fr/
fr
AIzaSyAYiBZKx7MnpbEhh9jyipgxe19OcubqV5w
April 1, 2024
270137
Turkey
TUR
true
2
1
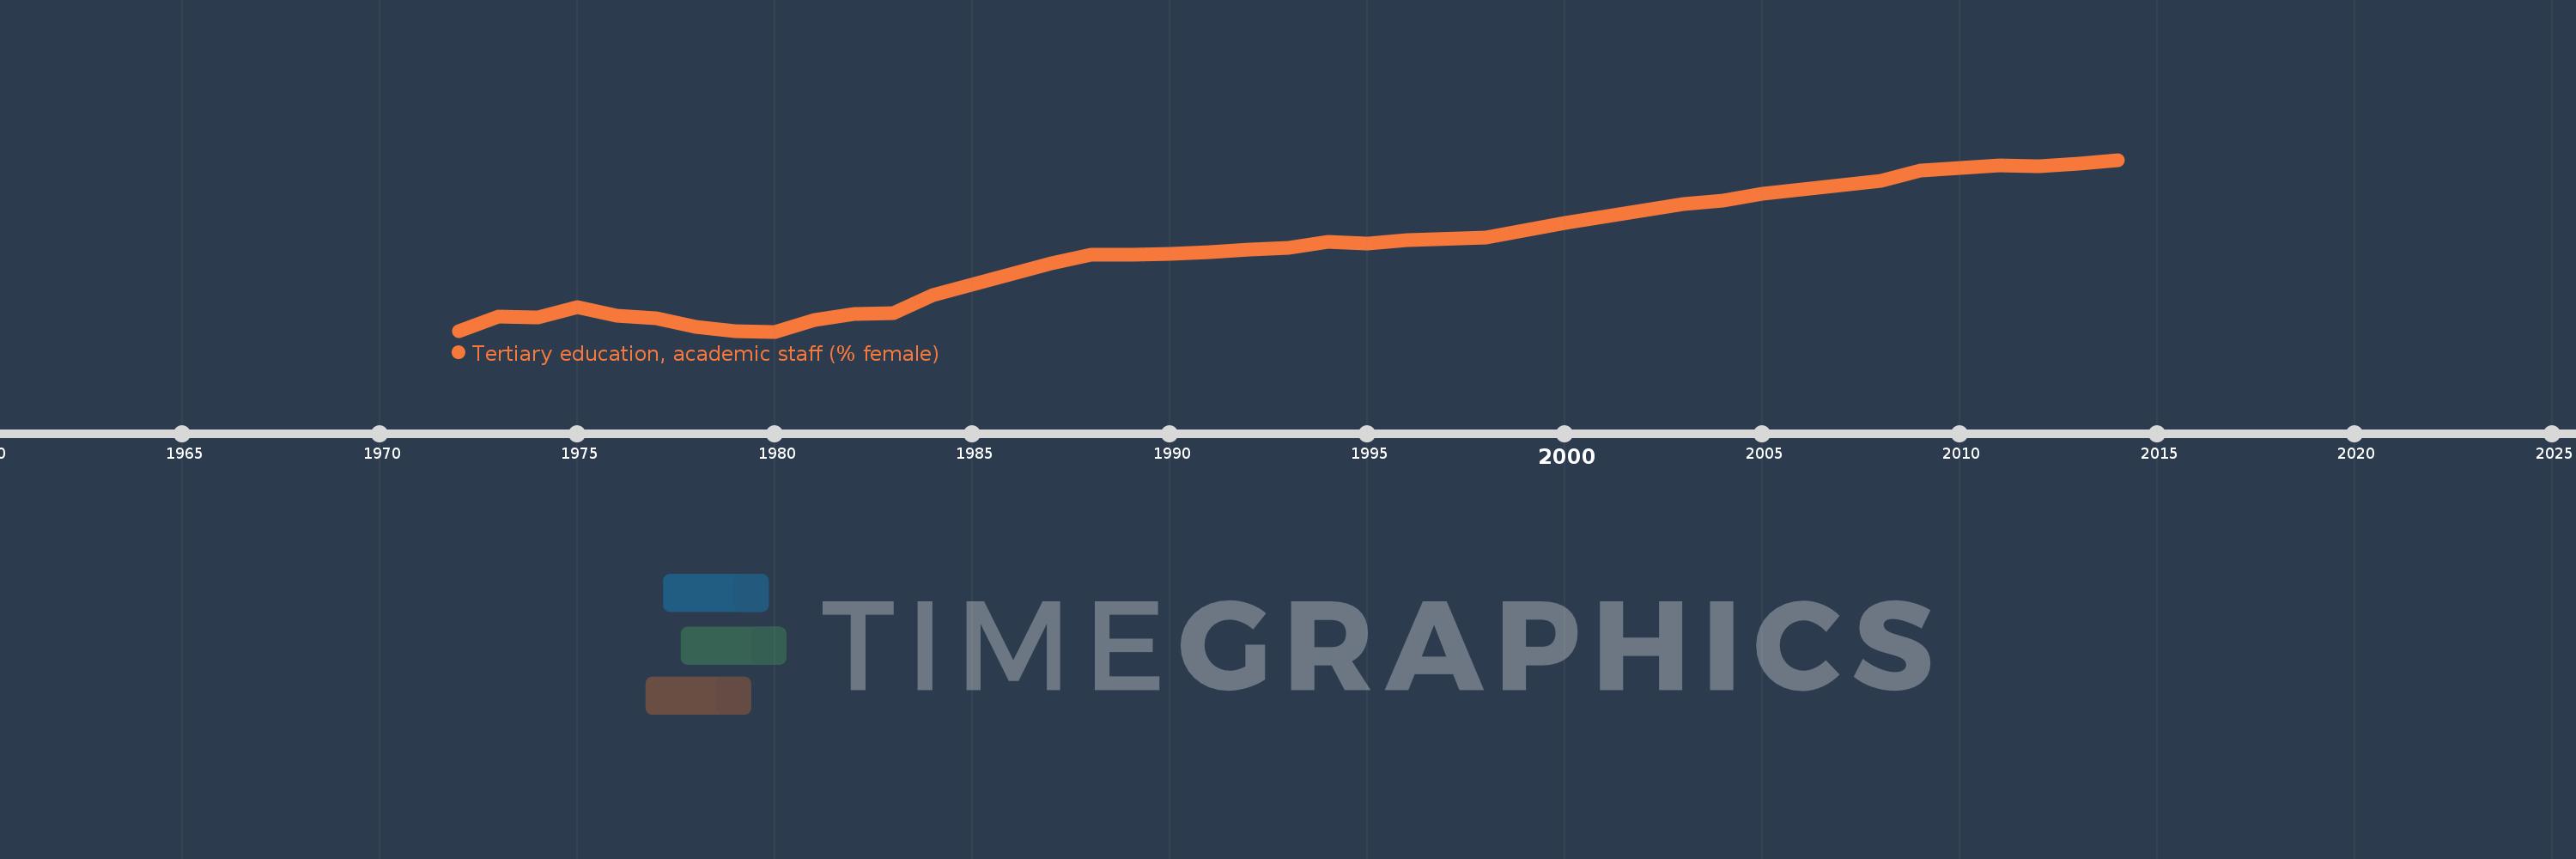
Tertiary education, academic staff (% female)
2014,2013,2012,2011,2010,2009,2008,2007,2006,2005,2004,2003,2000,1998,1996,1995,1994,1993,1992,1991,1990,1989,1988,1987,1984,1983,1982,1981,1980,1979,1978,1977,1976,1975,1974,1973,1972
Cette statistique dans les autres pays:
AfghanistanAlbaniaAlgeriaAndorraAngolaAntigua and BarbudaArab WorldArgentinaArmeniaArubaAustraliaAustriaAzerbaijanBahamas, TheBahrainBangladeshBarbadosBelarusBelgiumBelizeBeninBermudaBhutanBoliviaBosnia and HerzegovinaBotswanaBrazilBritish Virgin IslandsBrunei DarussalamBulgariaBurkina FasoBurundiCabo VerdeCambodiaCameroonCanadaCaribbean small statesCayman IslandsCentral African RepublicCentral Europe and the BalticsChadChileChinaColombiaComorosCongo, Dem. Rep.Congo, Rep.Costa RicaCote d'IvoireCroatiaCubaCyprusCzech RepublicDenmarkDjiboutiDominicaDominican RepublicEarly-demographic dividendEast Asia & PacificEast Asia & Pacific (excluding high income)East Asia & Pacific (IDA & IBRD countries)EcuadorEgypt, Arab Rep.El SalvadorEquatorial GuineaEritreaEstoniaEthiopiaEuro areaEurope & Central AsiaEurope & Central Asia (excluding high income)Europe & Central Asia (IDA & IBRD countries)European UnionFijiFinlandFragile and conflict affected situationsFranceGabonGambia, TheGeorgiaGermanyGhanaGreeceGrenadaGuineaGuyanaHaitiHeavily indebted poor countries (HIPC)High incomeHondurasHong Kong SAR, ChinaHungaryIBRD onlyIcelandIDA & IBRD totalIDA blendIDA onlyIDA totalIndiaIndonesiaIran, Islamic Rep.IraqIrelandItalyJamaicaJapanJordanKazakhstanKorea, Dem. People’s Rep.Korea, Rep.KuwaitKyrgyz RepublicLao PDRLate-demographic dividendLatin America & Caribbean Latin America & Caribbean (excluding high income)Latin America & the Caribbean (IDA & IBRD countries)LatviaLeast developed countries: UN classificationLebanonLesothoLiberiaLibyaLiechtensteinLithuaniaLow & middle incomeLow incomeLower middle incomeLuxembourgMacao SAR, ChinaMacedonia, FYRMadagascarMalawiMalaysiaMaldivesMaliMaltaMarshall IslandsMauritaniaMauritiusMicronesia, Fed. Sts.Middle East & North AfricaMiddle East & North Africa (excluding high income)Middle East & North Africa (IDA & IBRD countries)Middle incomeMoldovaMongoliaMoroccoMozambiqueMyanmarNamibiaNepalNetherlandsNew ZealandNicaraguaNigerNigeriaNorth AmericaNorwayOECD membersOmanOther small statesPacific island small statesPakistanPalauPanamaPapua New GuineaPeruPhilippinesPolandPortugalPost-demographic dividendPre-demographic dividendPuerto RicoQatarRomaniaRussian FederationRwandaSamoaSao Tome and PrincipeSaudi ArabiaSenegalSerbiaSeychellesSierra LeoneSingaporeSint Maarten (Dutch part)Slovak RepublicSloveniaSmall statesSomaliaSouth AfricaSouth AsiaSouth Asia (IDA & IBRD)SpainSri LankaSt. Kitts and NevisSt. LuciaSt. Vincent and the GrenadinesSub-Saharan Africa Sub-Saharan Africa (excluding high income)Sub-Saharan Africa (IDA & IBRD countries)SudanSurinameSwazilandSwedenSwitzerlandSyrian Arab RepublicTajikistanTanzaniaThailandTimor-LesteTogoTongaTrinidad and TobagoTunisiaTurkeyTurkmenistanUgandaUnited Arab EmiratesUnited KingdomUnited StatesUpper middle incomeUruguayUzbekistanVenezuela, RBVietnamWest Bank and GazaWorldYemen, Rep.Zimbabwe La ligne de temps
Cette échelle de temps montre un graphique de 1972 année à 2014 année Turkey. Les données jusqu'à 1971 année ne sont pas présentés. Quantité d'observations actuelles selon dates: 37.
Source (désignation):
Les indicateurs du développement mondiale
Source (organisation):
United Nations Educational, Scientific, and Cultural Organization (UNESCO) Institute for Statistics.
Catégories:
Education
Dernière mise à jour
23 avr. 2017
Les indicateurs de changement de valeurs selon les années
Minimum:
22.723
1 janv. 1980
Maximum:
41.565
1 janv. 2014
Pour la date d''observation
Valeur
Changement absolu
Le changement par rapport à la valeur précédente
1 janv. 1972
22.733
+22.733
0.0%
1 janv. 1973
24.372
+1.64
7.21%
1 janv. 1974
24.32
-0.053
-0.22%
1 janv. 1975
25.44
+1.12
4.6%
1 janv. 1976
24.438
-1.002
-3.94%
1 janv. 1977
24.158
-0.279
-1.14%
1 janv. 1978
23.256
-0.902
-3.73%
1 janv. 1979
22.815
-0.44
-1.89%
1 janv. 1980
22.723
-0.092
-0.4%
1 janv. 1981
24.014
+1.291
5.68%
1 janv. 1982
24.619
+0.605
2.52%
1 janv. 1983
24.752
+0.133
0.54%
1 janv. 1984
26.767
+2.015
8.14%
1 janv. 1987
30.259
+3.492
13.05%
1 janv. 1988
31.109
+0.85
2.81%
1 janv. 1989
31.196
+0.087
0.28%
1 janv. 1990
31.253
+0.057
0.18%
1 janv. 1991
31.471
+0.219
0.7%
1 janv. 1992
31.707
+0.235
0.75%
1 janv. 1993
31.888
+0.181
0.57%
1 janv. 1994
32.544
+0.656
2.06%
1 janv. 1995
32.398
-0.146
-0.45%
1 janv. 1996
32.79
+0.393
1.21%
1 janv. 1998
33.025
+0.235
0.72%
1 janv. 2000
34.636
+1.61
4.88%
1 janv. 2003
36.687
+2.051
5.92%
1 janv. 2004
37.068
+0.381
1.04%
1 janv. 2005
37.889
+0.821
2.21%
1 janv. 2006
38.289
+0.4
1.06%
1 janv. 2007
38.755
+0.465
1.21%
1 janv. 2008
39.278
+0.524
1.35%
1 janv. 2009
40.35
+1.072
2.73%
1 janv. 2010
40.656
+0.306
0.76%
1 janv. 2011
40.911
+0.255
0.63%
1 janv. 2012
40.898
-0.013
-0.03%
1 janv. 2013
41.131
+0.233
0.57%
1 janv. 2014
41.565
+0.434
1.05%
Classement des pays selon les statistiques actuelles par années


Commentaires: