29
/fr/
fr
AIzaSyAYiBZKx7MnpbEhh9jyipgxe19OcubqV5w
April 1, 2024
46093
Low income
LIC
false
2
1
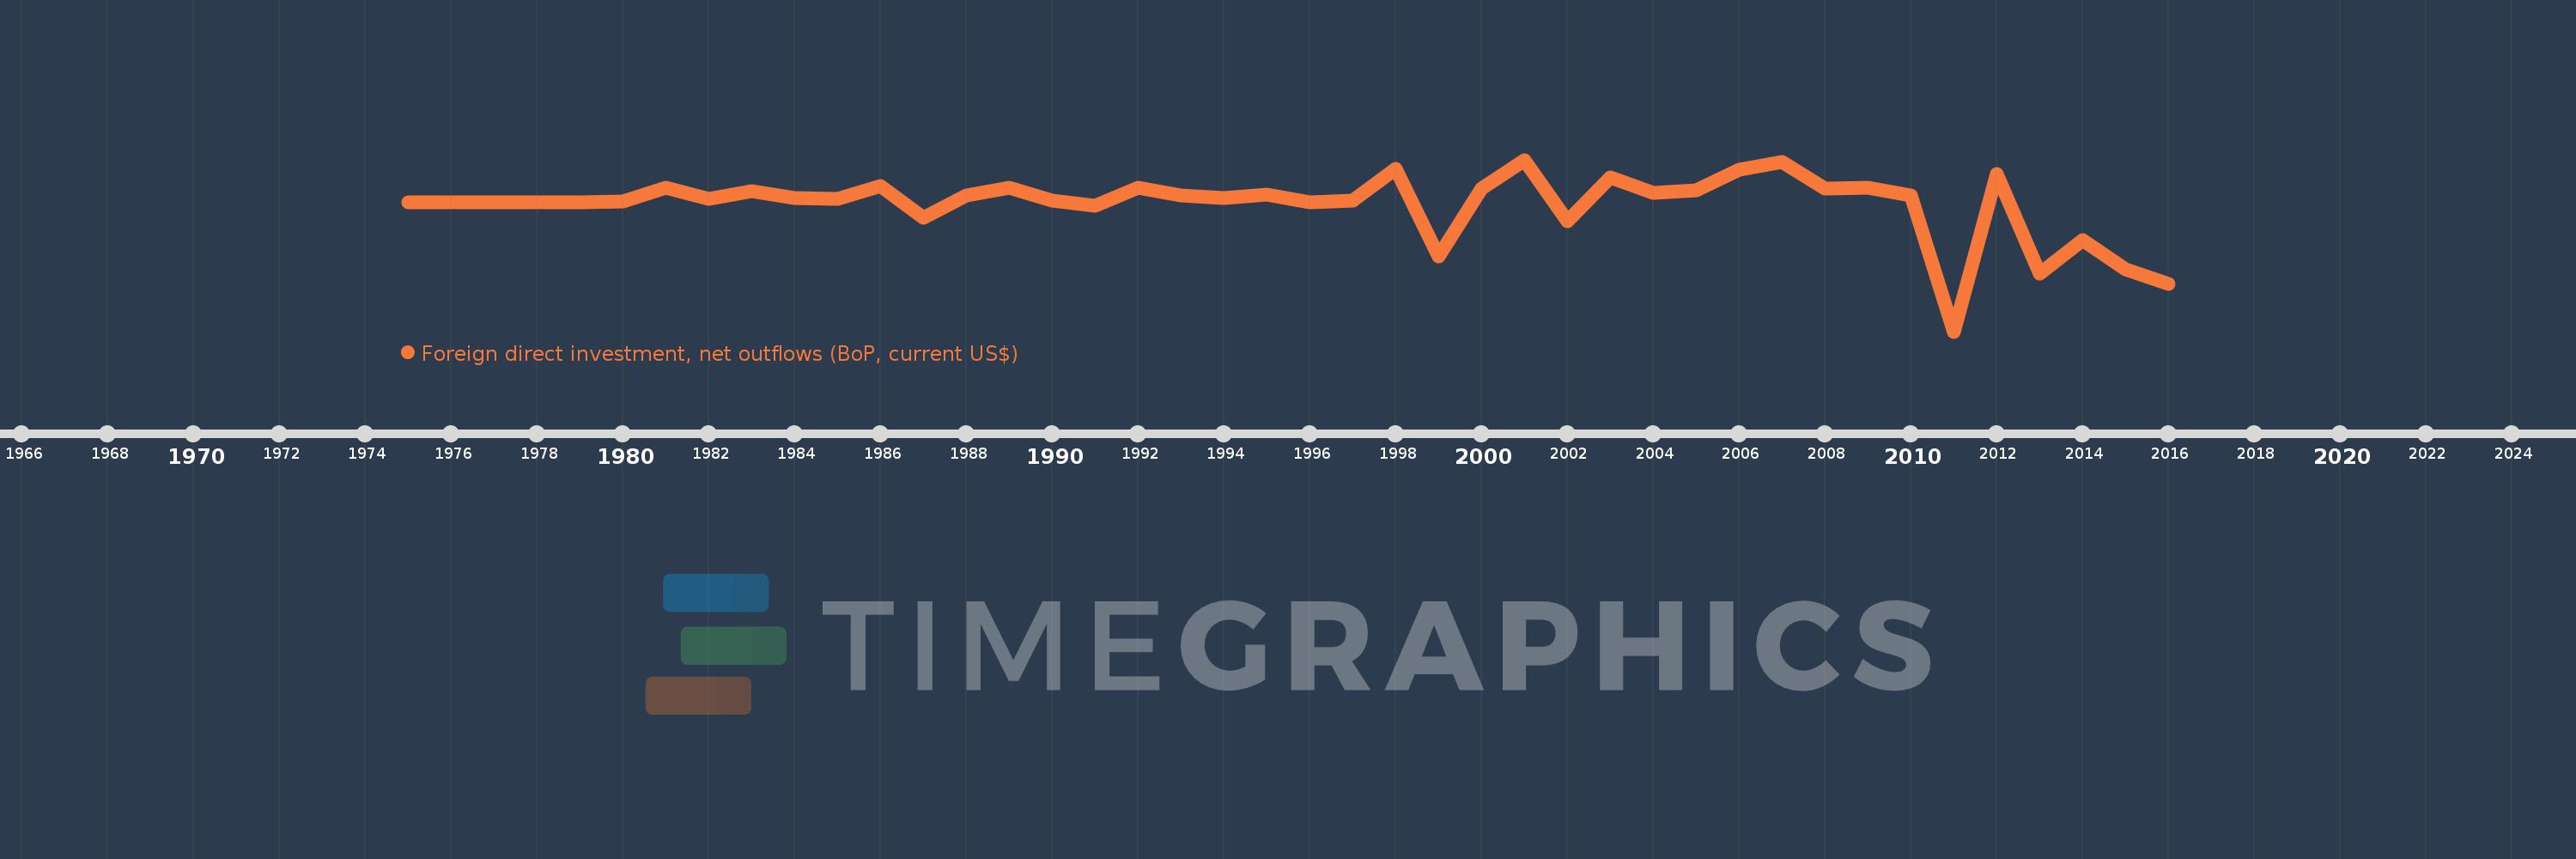
Foreign direct investment, net outflows (BoP, current US$)
2016,2015,2014,2013,2012,2011,2010,2009,2008,2007,2006,2005,2004,2003,2002,2001,2000,1999,1998,1997,1996,1995,1994,1993,1992,1991,1990,1989,1988,1987,1986,1985,1984,1983,1982,1981,1980,1979,1978,1977,1976,1975
Cette statistique dans les autres pays:
AfghanistanAlbaniaAlgeriaAngolaAntigua and BarbudaArab WorldArgentinaArmeniaArubaAustraliaAustriaAzerbaijanBahamas, TheBahrainBangladeshBarbadosBelarusBelgiumBelizeBeninBermudaBoliviaBosnia and HerzegovinaBotswanaBrazilBritish Virgin IslandsBrunei DarussalamBulgariaBurkina FasoBurundiCabo VerdeCambodiaCameroonCanadaCaribbean small statesCayman IslandsCentral African RepublicCentral Europe and the BalticsChadChileChinaColombiaComorosCongo, Dem. Rep.Congo, Rep.Costa RicaCote d'IvoireCroatiaCuracaoCyprusCzech RepublicDenmarkDominicaDominican RepublicEarly-demographic dividendEast Asia & PacificEast Asia & Pacific (excluding high income)East Asia & Pacific (IDA & IBRD countries)EcuadorEgypt, Arab Rep.El SalvadorEquatorial GuineaEritreaEstoniaEuro areaEurope & Central AsiaEurope & Central Asia (excluding high income)Europe & Central Asia (IDA & IBRD countries)European UnionFijiFinlandFragile and conflict affected situationsFranceFrench PolynesiaGabonGambia, TheGeorgiaGermanyGhanaGreeceGrenadaGuatemalaGuineaGuinea-BissauGuyanaHaitiHeavily indebted poor countries (HIPC)High incomeHondurasHong Kong SAR, ChinaHungaryIBRD onlyIcelandIDA & IBRD totalIDA blendIDA onlyIDA totalIndiaIndonesiaIran, Islamic Rep.IraqIrelandIsraelItalyJamaicaJapanJordanKazakhstanKenyaKiribatiKorea, Dem. People’s Rep.Korea, Rep.KosovoKuwaitKyrgyz RepublicLao PDRLate-demographic dividendLatin America & Caribbean Latin America & Caribbean (excluding high income)Latin America & the Caribbean (IDA & IBRD countries)LatviaLeast developed countries: UN classificationLebanonLesothoLiberiaLibyaLithuaniaLow & middle incomeLow incomeLower middle incomeLuxembourgMacao SAR, ChinaMacedonia, FYRMadagascarMalawiMalaysiaMaliMaltaMarshall IslandsMauritaniaMauritiusMexicoMicronesia, Fed. Sts.Middle East & North AfricaMiddle East & North Africa (excluding high income)Middle East & North Africa (IDA & IBRD countries)Middle incomeMoldovaMongoliaMontenegroMoroccoMozambiqueNamibiaNauruNetherlandsNew CaledoniaNew ZealandNicaraguaNigerNigeriaNorth AmericaNorthern Mariana IslandsNorwayOECD membersOmanOther small statesPacific island small statesPakistanPalauPanamaPapua New GuineaParaguayPeruPhilippinesPolandPortugalPost-demographic dividendPre-demographic dividendQatarRomaniaRussian FederationRwandaSamoaSao Tome and PrincipeSaudi ArabiaSenegalSerbiaSeychellesSierra LeoneSingaporeSint Maarten (Dutch part)Slovak RepublicSloveniaSmall statesSolomon IslandsSouth AfricaSouth AsiaSouth Asia (IDA & IBRD)SpainSri LankaSt. Kitts and NevisSt. LuciaSt. Vincent and the GrenadinesSub-Saharan Africa Sub-Saharan Africa (excluding high income)Sub-Saharan Africa (IDA & IBRD countries)SurinameSwazilandSwedenSwitzerlandSyrian Arab RepublicTajikistanTanzaniaThailandTimor-LesteTogoTongaTrinidad and TobagoTunisiaTurkeyUgandaUkraineUnited Arab EmiratesUnited KingdomUnited StatesUpper middle incomeUruguayVanuatuVenezuela, RBVietnamWest Bank and GazaWorldYemen, Rep.ZambiaZimbabwe La ligne de temps
Cette échelle de temps montre un graphique de 1975 année à 2016 année Low income. Les données jusqu'à 1974 année ne sont pas présentés. Quantité d'observations actuelles selon dates: 42.
Source (désignation):
Les indicateurs du développement mondiale
Source (organisation):
International Monetary Fund, Balance of Payments database, supplemented by data from the United Nations Conference on Trade and Development and official national sources.
Catégories:
Economy & Growth, Financial Sector
Dernière mise à jour
23 avr. 2017
Les indicateurs de changement de valeurs selon les années
Minimum:
-2.06 mds
1 janv. 2011
Maximum:
686.753 mln.
1 janv. 2001
Pour la date d''observation
Valeur
Changement absolu
Le changement par rapport à la valeur précédente
1 janv. 1975
3.93 mln.
+3.93 mln.
0.0%
1 janv. 1976
1.74 mln.
-2.19 mln.
-55.73%
1 janv. 1977
6.08 mln.
+4.34 mln.
249.43%
1 janv. 1978
7.71 mln.
+1.63 mln.
26.8%
1 janv. 1979
980.27 milles
-6.729 mln.
-87.28%
1 janv. 1980
14.289 mln.
+13.309 mln.
1.36 milles%
1 janv. 1981
233.904 mln.
+219.615 mln.
1.54 milles%
1 janv. 1982
56.25 mln.
-177.654 mln.
-75.95%
1 janv. 1983
183.668 mln.
+127.418 mln.
226.52%
1 janv. 1984
68.944 mln.
-114.724 mln.
-62.46%
1 janv. 1985
64.21 mln.
-4.733 mln.
-6.87%
1 janv. 1986
261.245 mln.
+197.034 mln.
306.86%
1 janv. 1987
-238.482 mln.
-499.726 mln.
-191.29%
1 janv. 1988
115.88 mln.
+354.362 mln.
-148.59%
1 janv. 1989
233.815 mln.
+117.935 mln.
101.77%
1 janv. 1990
30.438 mln.
-203.377 mln.
-86.98%
1 janv. 1991
-52.198 mln.
-82.636 mln.
-271.49%
1 janv. 1992
243.518 mln.
+295.716 mln.
-566.53%
1 janv. 1993
111.259 mln.
-132.259 mln.
-54.31%
1 janv. 1994
79.318 mln.
-31.941 mln.
-28.71%
1 janv. 1995
125.964 mln.
+46.646 mln.
58.81%
1 janv. 1996
11.253 mln.
-114.711 mln.
-91.07%
1 janv. 1997
38.344 mln.
+27.091 mln.
240.74%
1 janv. 1998
544.495 mln.
+506.151 mln.
1.32 milles%
1 janv. 1999
-857.101 mln.
-1.402 mds
-257.41%
1 janv. 2000
231.18 mln.
+1.088 mds
-126.97%
1 janv. 2001
686.753 mln.
+455.573 mln.
197.06%
1 janv. 2002
-298.031 mln.
-984.784 mln.
-143.4%
1 janv. 2003
400.912 mln.
+698.944 mln.
-234.52%
1 janv. 2004
159.655 mln.
-241.257 mln.
-60.18%
1 janv. 2005
201.716 mln.
+42.061 mln.
26.34%
1 janv. 2006
524.144 mln.
+322.428 mln.
159.84%
1 janv. 2007
648.189 mln.
+124.044 mln.
23.67%
1 janv. 2008
233.256 mln.
-414.932 mln.
-64.01%
1 janv. 2009
245.332 mln.
+12.075 mln.
5.18%
1 janv. 2010
111.638 mln.
-133.693 mln.
-54.49%
1 janv. 2011
-2.06 mds
-2.172 mds
-1.95 milles%
1 janv. 2012
460.274 mln.
+2.521 mds
-122.34%
1 janv. 2013
-1.137 mds
-1.598 mds
-347.11%
1 janv. 2014
-591.503 mln.
+545.872 mln.
-47.99%
1 janv. 2015
-1.066 mds
-474.389 mln.
80.2%
1 janv. 2016
-1.297 mds
-231.457 mln.
21.71%
Classement des pays selon les statistiques actuelles par années


Commentaires: