29
/fr/
fr
AIzaSyAYiBZKx7MnpbEhh9jyipgxe19OcubqV5w
April 1, 2024
207923
Netherlands
NLD
true
2
1
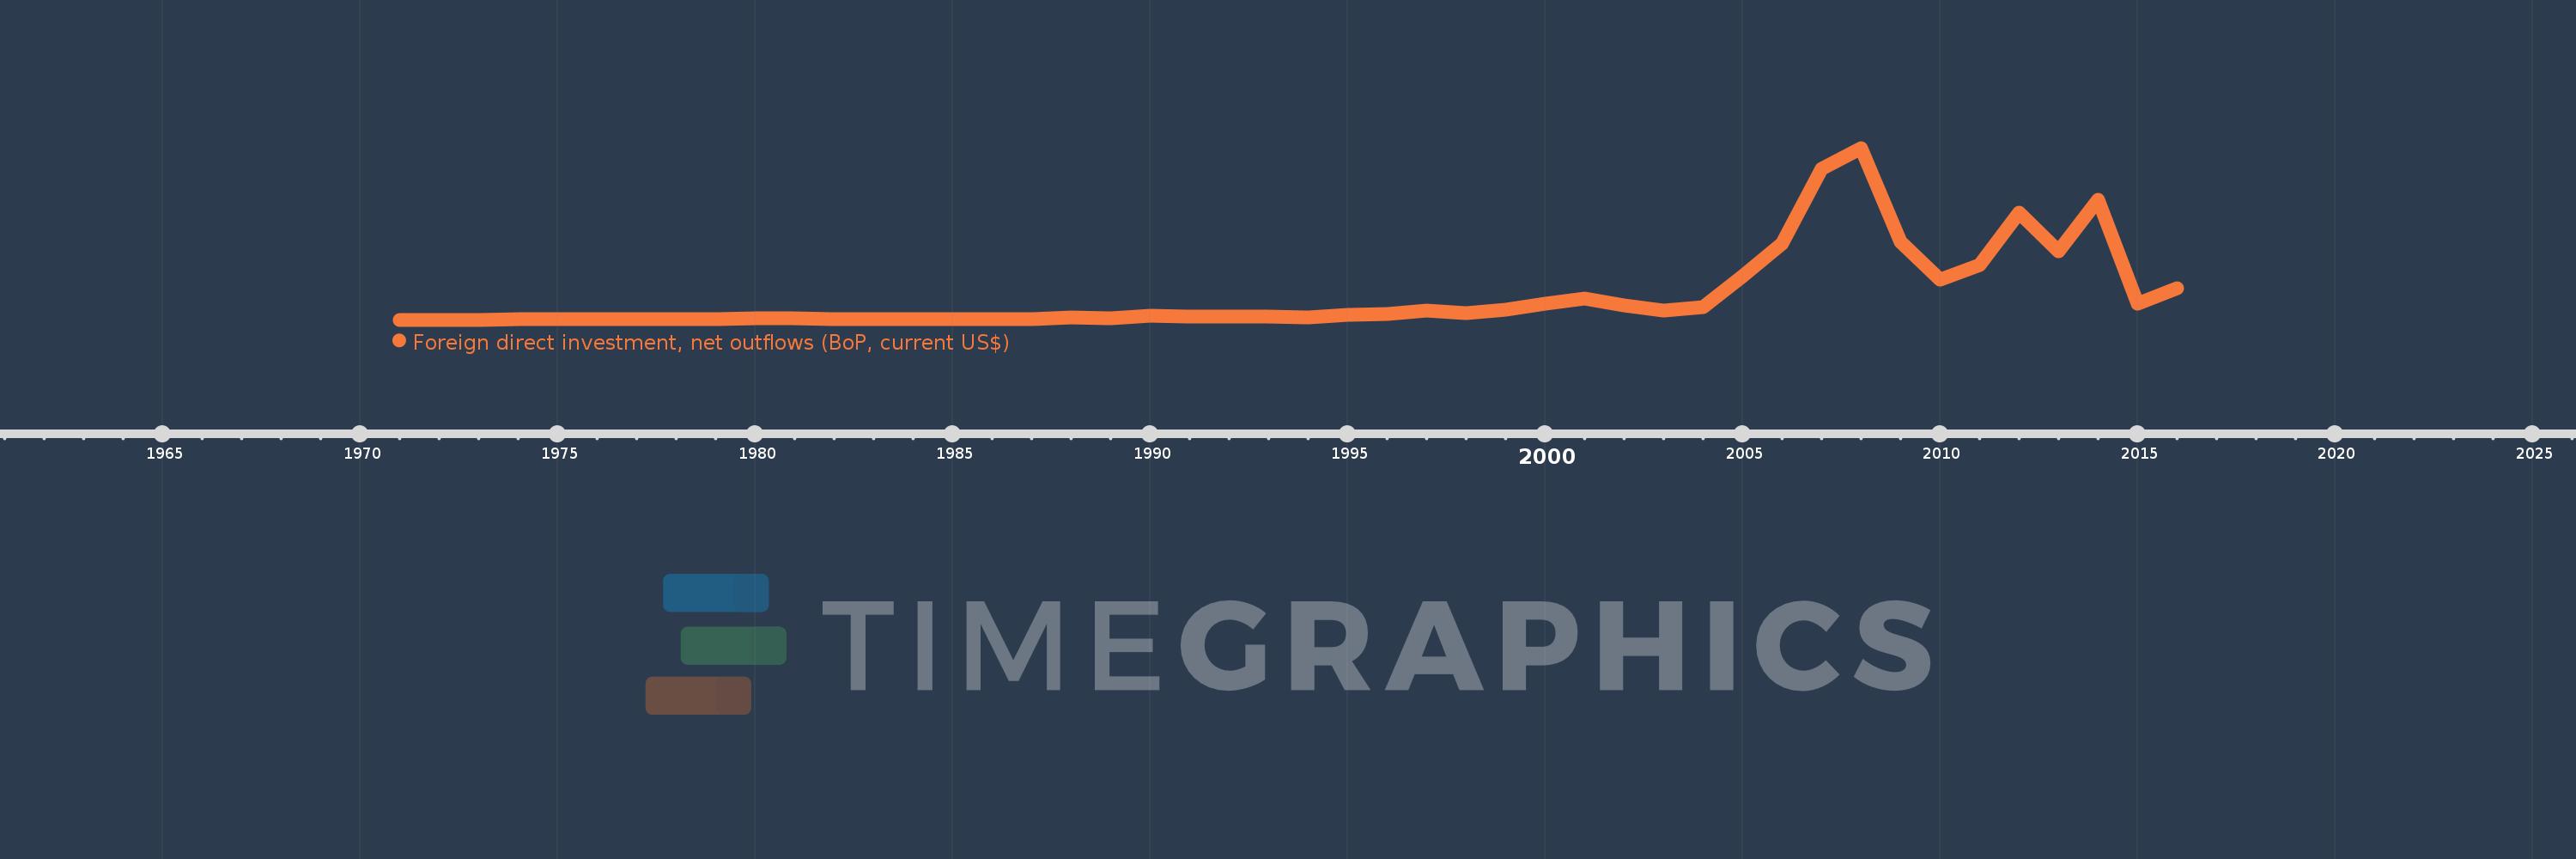
Foreign direct investment, net outflows (BoP, current US$)
2016,2015,2014,2013,2012,2011,2010,2009,2008,2007,2006,2005,2004,2003,2002,2001,2000,1999,1998,1997,1996,1995,1994,1993,1992,1991,1990,1989,1988,1987,1986,1985,1984,1983,1982,1981,1980,1979,1978,1977,1976,1975,1974,1973,1972,1971
Cette statistique dans les autres pays:
AfghanistanAlbaniaAlgeriaAngolaAntigua and BarbudaArab WorldArgentinaArmeniaArubaAustraliaAustriaAzerbaijanBahamas, TheBahrainBangladeshBarbadosBelarusBelgiumBelizeBeninBermudaBoliviaBosnia and HerzegovinaBotswanaBrazilBritish Virgin IslandsBrunei DarussalamBulgariaBurkina FasoBurundiCabo VerdeCambodiaCameroonCanadaCaribbean small statesCayman IslandsCentral African RepublicCentral Europe and the BalticsChadChileChinaColombiaComorosCongo, Dem. Rep.Congo, Rep.Costa RicaCote d'IvoireCroatiaCuracaoCyprusCzech RepublicDenmarkDominicaDominican RepublicEarly-demographic dividendEast Asia & PacificEast Asia & Pacific (excluding high income)East Asia & Pacific (IDA & IBRD countries)EcuadorEgypt, Arab Rep.El SalvadorEquatorial GuineaEritreaEstoniaEuro areaEurope & Central AsiaEurope & Central Asia (excluding high income)Europe & Central Asia (IDA & IBRD countries)European UnionFijiFinlandFragile and conflict affected situationsFranceFrench PolynesiaGabonGambia, TheGeorgiaGermanyGhanaGreeceGrenadaGuatemalaGuineaGuinea-BissauGuyanaHaitiHeavily indebted poor countries (HIPC)High incomeHondurasHong Kong SAR, ChinaHungaryIBRD onlyIcelandIDA & IBRD totalIDA blendIDA onlyIDA totalIndiaIndonesiaIran, Islamic Rep.IraqIrelandIsraelItalyJamaicaJapanJordanKazakhstanKenyaKiribatiKorea, Dem. People’s Rep.Korea, Rep.KosovoKuwaitKyrgyz RepublicLao PDRLate-demographic dividendLatin America & Caribbean Latin America & Caribbean (excluding high income)Latin America & the Caribbean (IDA & IBRD countries)LatviaLeast developed countries: UN classificationLebanonLesothoLiberiaLibyaLithuaniaLow & middle incomeLow incomeLower middle incomeLuxembourgMacao SAR, ChinaMacedonia, FYRMadagascarMalawiMalaysiaMaliMaltaMarshall IslandsMauritaniaMauritiusMexicoMicronesia, Fed. Sts.Middle East & North AfricaMiddle East & North Africa (excluding high income)Middle East & North Africa (IDA & IBRD countries)Middle incomeMoldovaMongoliaMontenegroMoroccoMozambiqueNamibiaNauruNetherlandsNew CaledoniaNew ZealandNicaraguaNigerNigeriaNorth AmericaNorthern Mariana IslandsNorwayOECD membersOmanOther small statesPacific island small statesPakistanPalauPanamaPapua New GuineaParaguayPeruPhilippinesPolandPortugalPost-demographic dividendPre-demographic dividendQatarRomaniaRussian FederationRwandaSamoaSao Tome and PrincipeSaudi ArabiaSenegalSerbiaSeychellesSierra LeoneSingaporeSint Maarten (Dutch part)Slovak RepublicSloveniaSmall statesSolomon IslandsSouth AfricaSouth AsiaSouth Asia (IDA & IBRD)SpainSri LankaSt. Kitts and NevisSt. LuciaSt. Vincent and the GrenadinesSub-Saharan Africa Sub-Saharan Africa (excluding high income)Sub-Saharan Africa (IDA & IBRD countries)SurinameSwazilandSwedenSwitzerlandSyrian Arab RepublicTajikistanTanzaniaThailandTimor-LesteTogoTongaTrinidad and TobagoTunisiaTurkeyUgandaUkraineUnited Arab EmiratesUnited KingdomUnited StatesUpper middle incomeUruguayVanuatuVenezuela, RBVietnamWest Bank and GazaWorldYemen, Rep.ZambiaZimbabwe La ligne de temps
Cette échelle de temps montre un graphique de 1971 année à 2016 année Netherlands. Les données jusqu'à 1970 année ne sont pas présentés. Quantité d'observations actuelles selon dates: 46.
Source (désignation):
Les indicateurs du développement mondiale
Source (organisation):
International Monetary Fund, Balance of Payments database, supplemented by data from the United Nations Conference on Trade and Development and official national sources.
Catégories:
Economy & Growth, Financial Sector
Dernière mise à jour
23 avr. 2017
Les indicateurs de changement de valeurs selon les années
Minimum:
1.317 mds
1 janv. 1971
Maximum:
596.514 mds
1 janv. 2008
Pour la date d''observation
Valeur
Changement absolu
Le changement par rapport à la valeur précédente
1 janv. 1971
1.317 mds
+1.317 mds
0.0%
1 janv. 1972
1.319 mds
+2.268 mln.
0.17%
1 janv. 1973
1.64 mds
+321.325 mln.
24.36%
1 janv. 1974
2.117 mds
+476.511 mln.
29.05%
1 janv. 1975
2.789 mds
+671.654 mln.
31.73%
1 janv. 1976
2.519 mds
-269.772 mln.
-9.67%
1 janv. 1977
2.353 mds
-166.327 mln.
-6.6%
1 janv. 1978
3.038 mds
+685.872 mln.
29.15%
1 janv. 1979
3.386 mds
+347.304 mln.
11.43%
1 janv. 1980
6.282 mds
+2.896 mds
85.55%
1 janv. 1981
5.918 mds
-364.053 mln.
-5.8%
1 janv. 1982
4.527 mds
-1.391 mds
-23.51%
1 janv. 1983
3.263 mds
-1.264 mds
-27.92%
1 janv. 1984
3.835 mds
+572.492 mln.
17.55%
1 janv. 1985
4.844 mds
+1.009 mds
26.31%
1 janv. 1986
2.705 mds
-2.14 mds
-44.17%
1 janv. 1987
4.093 mds
+1.389 mds
51.35%
1 janv. 1988
8.658 mds
+4.565 mds
111.51%
1 janv. 1989
7.117 mds
-1.541 mds
-17.8%
1 janv. 1990
14.859 mds
+7.742 mds
108.78%
1 janv. 1991
13.718 mds
-1.141 mds
-7.68%
1 janv. 1992
12.835 mds
-883.223 mln.
-6.44%
1 janv. 1993
12.776 mds
-58.925 mln.
-0.46%
1 janv. 1994
9.954 mds
-2.822 mds
-22.09%
1 janv. 1995
17.581 mds
+7.627 mds
76.62%
1 janv. 1996
20.188 mds
+2.606 mds
14.82%
1 janv. 1997
31.937 mds
+11.749 mds
58.2%
1 janv. 1998
24.499 mds
-7.438 mds
-23.29%
1 janv. 1999
36.938 mds
+12.439 mds
50.77%
1 janv. 2000
57.151 mds
+20.213 mds
54.72%
1 janv. 2001
74.51 mds
+17.359 mds
30.37%
1 janv. 2002
50.764 mds
-23.746 mds
-31.87%
1 janv. 2003
31.758 mds
-19.007 mds
-37.44%
1 janv. 2004
44.641 mds
+12.883 mds
40.57%
1 janv. 2005
151.363 mds
+106.722 mds
239.07%
1 janv. 2006
266.636 mds
+115.273 mds
76.16%
1 janv. 2007
523.276 mds
+256.64 mds
96.25%
1 janv. 2008
596.514 mds
+73.238 mds
14.0%
1 janv. 2009
272.348 mds
-324.167 mds
-54.34%
1 janv. 2010
140.301 mds
-132.047 mds
-48.48%
1 janv. 2011
191.5 mds
+51.199 mds
36.49%
1 janv. 2012
371.407 mds
+179.907 mds
93.95%
1 janv. 2013
238.025 mds
-133.382 mds
-35.91%
1 janv. 2014
415.85 mds
+177.825 mds
74.71%
1 janv. 2015
57.665 mds
-358.185 mds
-86.13%
1 janv. 2016
111.384 mds
+53.719 mds
93.16%
Classement des pays selon les statistiques actuelles par années


Commentaires: