29
/fr/
fr
AIzaSyAYiBZKx7MnpbEhh9jyipgxe19OcubqV5w
April 1, 2024
101071
Canada
CAN
true
2
1
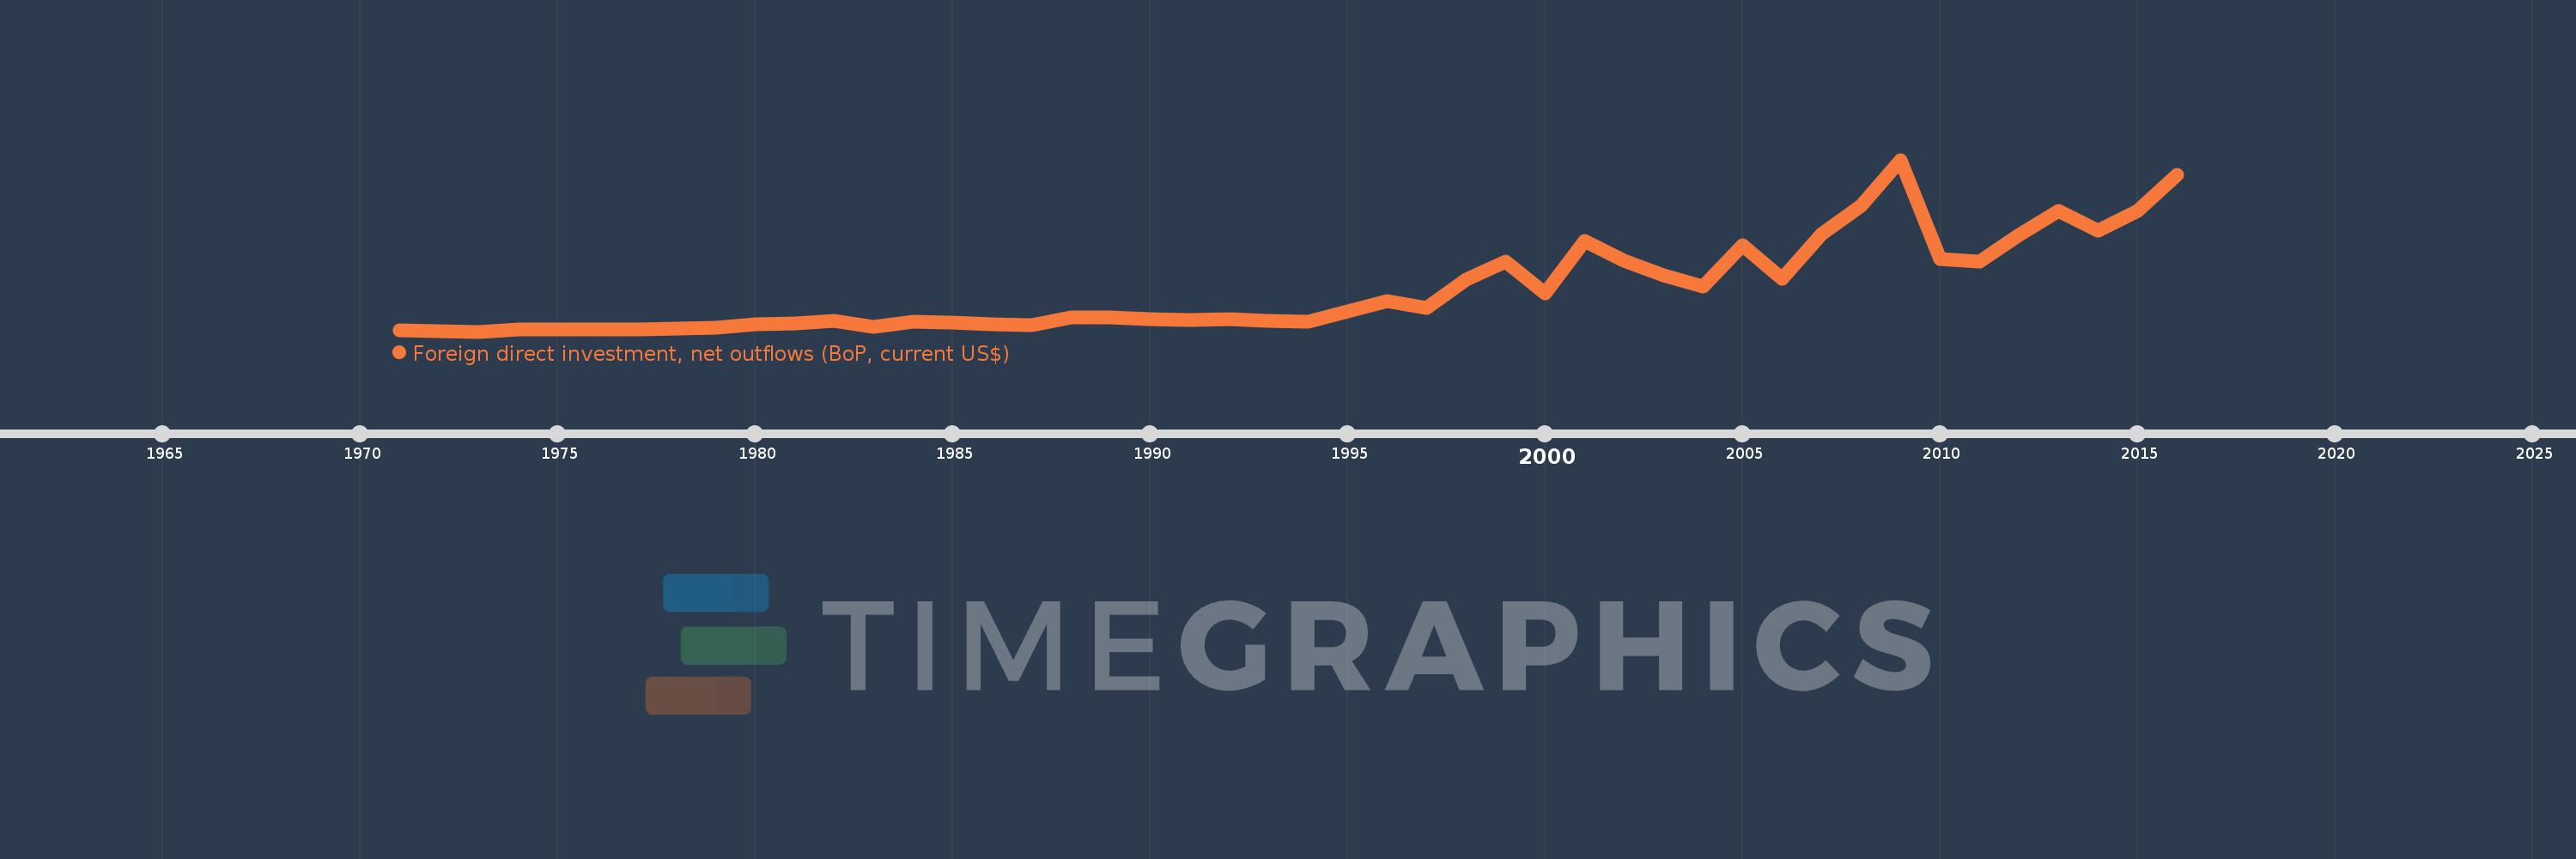
Foreign direct investment, net outflows (BoP, current US$)
2016,2015,2014,2013,2012,2011,2010,2009,2008,2007,2006,2005,2004,2003,2002,2001,2000,1999,1998,1997,1996,1995,1994,1993,1992,1991,1990,1989,1988,1987,1986,1985,1984,1983,1982,1981,1980,1979,1978,1977,1976,1975,1974,1973,1972,1971
Cette statistique dans les autres pays:
AfghanistanAlbaniaAlgeriaAngolaAntigua and BarbudaArab WorldArgentinaArmeniaArubaAustraliaAustriaAzerbaijanBahamas, TheBahrainBangladeshBarbadosBelarusBelgiumBelizeBeninBermudaBoliviaBosnia and HerzegovinaBotswanaBrazilBritish Virgin IslandsBrunei DarussalamBulgariaBurkina FasoBurundiCabo VerdeCambodiaCameroonCanadaCaribbean small statesCayman IslandsCentral African RepublicCentral Europe and the BalticsChadChileChinaColombiaComorosCongo, Dem. Rep.Congo, Rep.Costa RicaCote d'IvoireCroatiaCuracaoCyprusCzech RepublicDenmarkDominicaDominican RepublicEarly-demographic dividendEast Asia & PacificEast Asia & Pacific (excluding high income)East Asia & Pacific (IDA & IBRD countries)EcuadorEgypt, Arab Rep.El SalvadorEquatorial GuineaEritreaEstoniaEuro areaEurope & Central AsiaEurope & Central Asia (excluding high income)Europe & Central Asia (IDA & IBRD countries)European UnionFijiFinlandFragile and conflict affected situationsFranceFrench PolynesiaGabonGambia, TheGeorgiaGermanyGhanaGreeceGrenadaGuatemalaGuineaGuinea-BissauGuyanaHaitiHeavily indebted poor countries (HIPC)High incomeHondurasHong Kong SAR, ChinaHungaryIBRD onlyIcelandIDA & IBRD totalIDA blendIDA onlyIDA totalIndiaIndonesiaIran, Islamic Rep.IraqIrelandIsraelItalyJamaicaJapanJordanKazakhstanKenyaKiribatiKorea, Dem. People’s Rep.Korea, Rep.KosovoKuwaitKyrgyz RepublicLao PDRLate-demographic dividendLatin America & Caribbean Latin America & Caribbean (excluding high income)Latin America & the Caribbean (IDA & IBRD countries)LatviaLeast developed countries: UN classificationLebanonLesothoLiberiaLibyaLithuaniaLow & middle incomeLow incomeLower middle incomeLuxembourgMacao SAR, ChinaMacedonia, FYRMadagascarMalawiMalaysiaMaliMaltaMarshall IslandsMauritaniaMauritiusMexicoMicronesia, Fed. Sts.Middle East & North AfricaMiddle East & North Africa (excluding high income)Middle East & North Africa (IDA & IBRD countries)Middle incomeMoldovaMongoliaMontenegroMoroccoMozambiqueNamibiaNauruNetherlandsNew CaledoniaNew ZealandNicaraguaNigerNigeriaNorth AmericaNorthern Mariana IslandsNorwayOECD membersOmanOther small statesPacific island small statesPakistanPalauPanamaPapua New GuineaParaguayPeruPhilippinesPolandPortugalPost-demographic dividendPre-demographic dividendQatarRomaniaRussian FederationRwandaSamoaSao Tome and PrincipeSaudi ArabiaSenegalSerbiaSeychellesSierra LeoneSingaporeSint Maarten (Dutch part)Slovak RepublicSloveniaSmall statesSolomon IslandsSouth AfricaSouth AsiaSouth Asia (IDA & IBRD)SpainSri LankaSt. Kitts and NevisSt. LuciaSt. Vincent and the GrenadinesSub-Saharan Africa Sub-Saharan Africa (excluding high income)Sub-Saharan Africa (IDA & IBRD countries)SurinameSwazilandSwedenSwitzerlandSyrian Arab RepublicTajikistanTanzaniaThailandTimor-LesteTogoTongaTrinidad and TobagoTunisiaTurkeyUgandaUkraineUnited Arab EmiratesUnited KingdomUnited StatesUpper middle incomeUruguayVanuatuVenezuela, RBVietnamWest Bank and GazaWorldYemen, Rep.ZambiaZimbabwe La ligne de temps
Cette échelle de temps montre un graphique de 1971 année à 2016 année Canada. Les données jusqu'à 1970 année ne sont pas présentés. Quantité d'observations actuelles selon dates: 46.
Source (désignation):
Les indicateurs du développement mondiale
Source (organisation):
International Monetary Fund, Balance of Payments database, supplemented by data from the United Nations Conference on Trade and Development and official national sources.
Catégories:
Economy & Growth, Financial Sector
Dernière mise à jour
23 avr. 2017
Les indicateurs de changement de valeurs selon les années
Minimum:
80.268 mln.
1 janv. 1973
Maximum:
88.684 mds
1 janv. 2009
Pour la date d''observation
Valeur
Changement absolu
Le changement par rapport à la valeur précédente
1 janv. 1971
929.472 mln.
+929.472 mln.
0.0%
1 janv. 1972
458.02 mln.
-471.453 mln.
-50.72%
1 janv. 1973
80.268 mln.
-377.752 mln.
-82.48%
1 janv. 1974
1.166 mds
+1.086 mds
1.35 milles%
1 janv. 1975
1.357 mds
+191.043 mln.
16.39%
1 janv. 1976
1.249 mds
-107.508 mln.
-7.92%
1 janv. 1977
1.003 mds
-246.862 mln.
-19.76%
1 janv. 1978
1.631 mds
+628.265 mln.
62.66%
1 janv. 1979
2.277 mds
+646.347 mln.
39.63%
1 janv. 1980
3.829 mds
+1.551 mds
68.13%
1 janv. 1981
4.093 mds
+264.909 mln.
6.92%
1 janv. 1982
5.546 mds
+1.452 mds
35.47%
1 janv. 1983
2.371 mds
-3.174 mds
-57.24%
1 janv. 1984
5.248 mds
+2.876 mds
121.31%
1 janv. 1985
4.584 mds
-663.142 mln.
-12.64%
1 janv. 1986
3.765 mds
-819.869 mln.
-17.88%
1 janv. 1987
3.365 mds
-399.498 mln.
-10.61%
1 janv. 1988
7.603 mds
+4.238 mds
125.95%
1 janv. 1989
7.346 mds
-257.319 mln.
-3.38%
1 janv. 1990
6.415 mds
-930.794 mln.
-12.67%
1 janv. 1991
6.05 mds
-364.691 mln.
-5.68%
1 janv. 1992
6.477 mds
+426.221 mln.
7.04%
1 janv. 1993
5.788 mds
-688.339 mln.
-10.63%
1 janv. 1994
5.141 mds
-647.158 mln.
-11.18%
1 janv. 1995
10.621 mds
+5.48 mds
106.59%
1 janv. 1996
15.829 mds
+5.208 mds
49.03%
1 janv. 1997
12.29 mds
-3.539 mds
-22.36%
1 janv. 1998
26.728 mds
+14.438 mds
117.48%
1 janv. 1999
36.35 mds
+9.622 mds
36.0%
1 janv. 2000
19.929 mds
-16.421 mds
-45.17%
1 janv. 2001
46.652 mds
+26.722 mds
134.09%
1 janv. 2002
36.834 mds
-9.818 mds
-21.04%
1 janv. 2003
29.262 mds
-7.572 mds
-20.56%
1 janv. 2004
23.429 mds
-5.833 mds
-19.93%
1 janv. 2005
44.822 mds
+21.393 mds
91.31%
1 janv. 2006
27.27 mds
-17.551 mds
-39.16%
1 janv. 2007
50.361 mds
+23.09 mds
84.67%
1 janv. 2008
65.137 mds
+14.776 mds
29.34%
1 janv. 2009
88.684 mds
+23.548 mds
36.15%
1 janv. 2010
37.707 mds
-50.978 mds
-57.48%
1 janv. 2011
36.336 mds
-1.371 mds
-3.63%
1 janv. 2012
50.093 mds
+13.757 mds
37.86%
1 janv. 2013
62.259 mds
+12.166 mds
24.29%
1 janv. 2014
51.967 mds
-10.292 mds
-16.53%
1 janv. 2015
62.203 mds
+10.236 mds
19.7%
1 janv. 2016
81.121 mds
+18.918 mds
30.41%
Classement des pays selon les statistiques actuelles par années


Commentaires: