29
/fr/
fr
AIzaSyAYiBZKx7MnpbEhh9jyipgxe19OcubqV5w
April 1, 2024
224833
Poland
POL
true
2
1
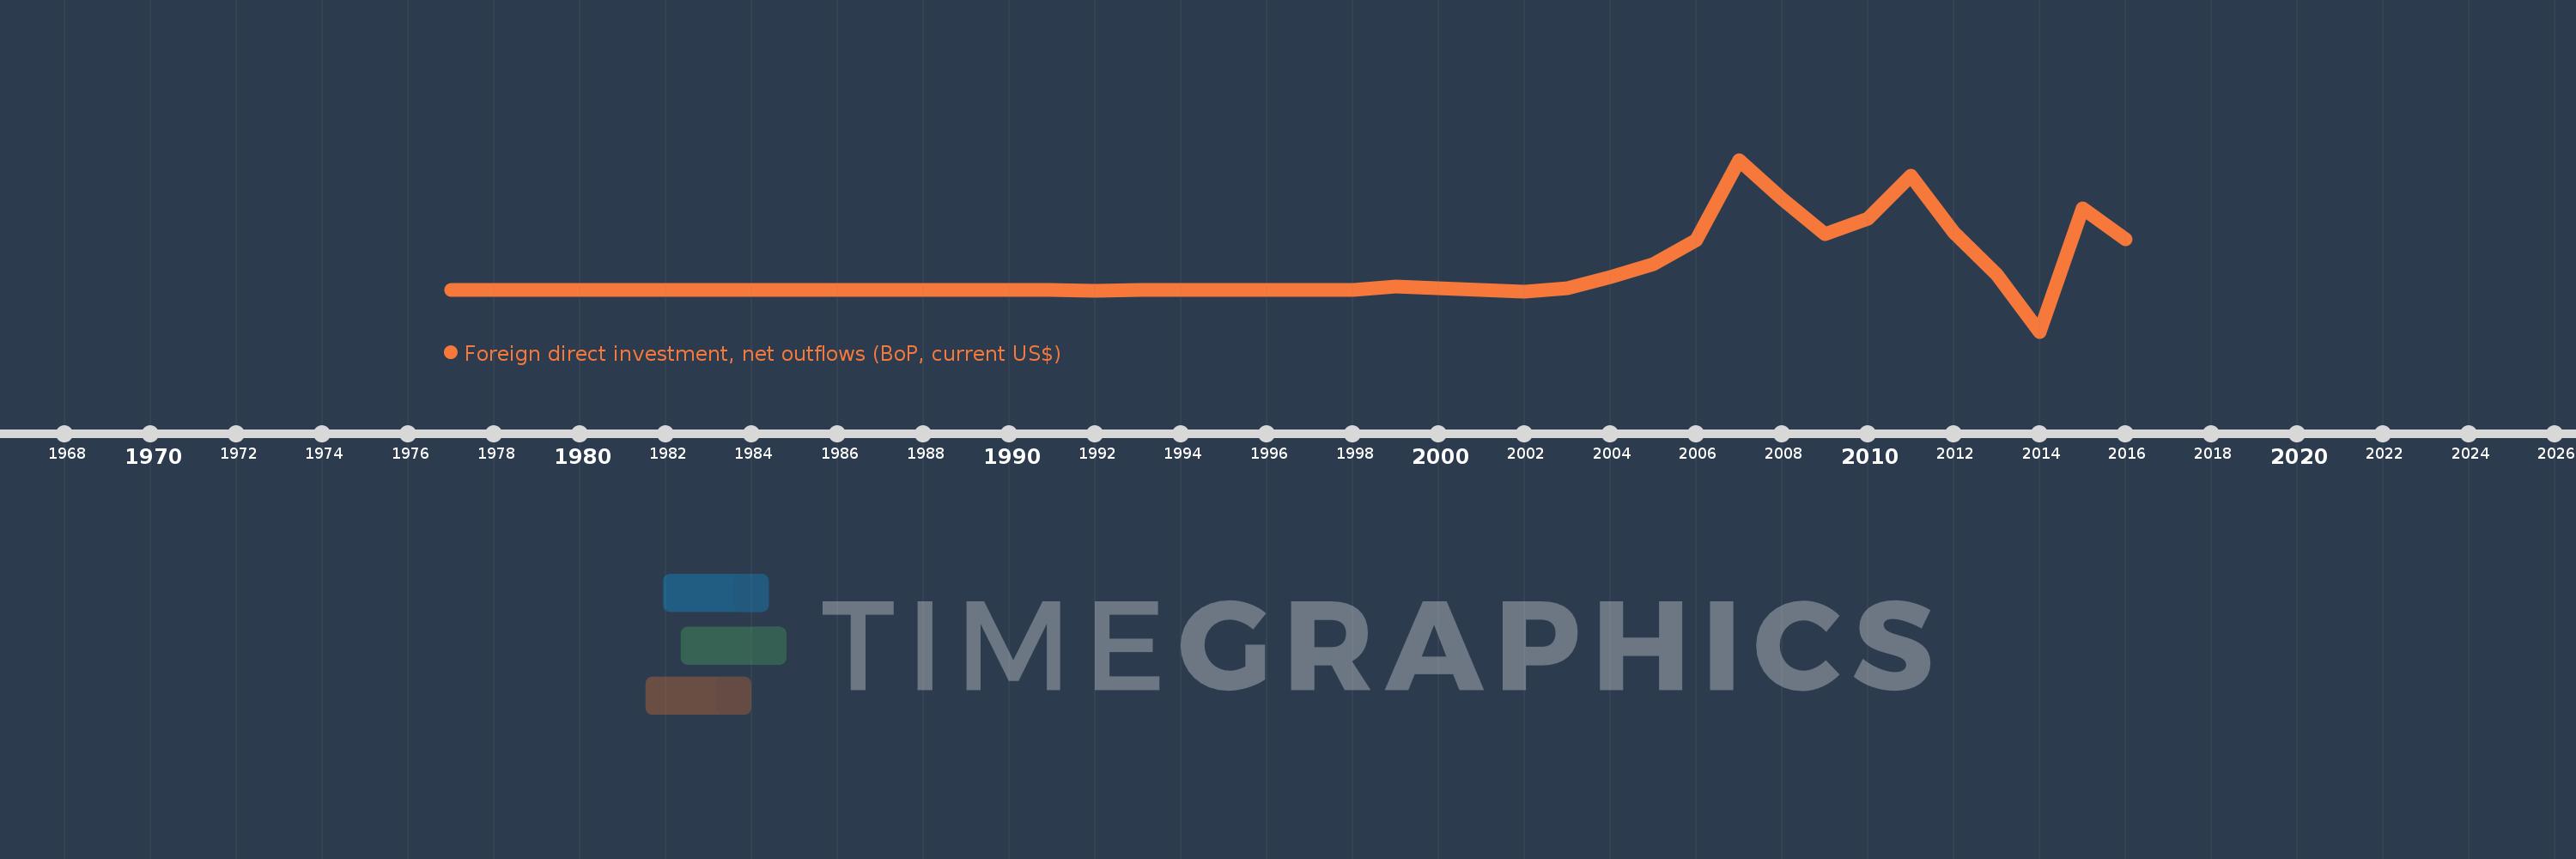
Foreign direct investment, net outflows (BoP, current US$)
2016,2015,2014,2013,2012,2011,2010,2009,2008,2007,2006,2005,2004,2003,2002,2001,2000,1999,1998,1997,1996,1995,1994,1993,1992,1991,1990,1989,1988,1987,1986,1985,1984,1983,1982,1981,1980,1979,1978,1977
Cette statistique dans les autres pays:
AfghanistanAlbaniaAlgeriaAngolaAntigua and BarbudaArab WorldArgentinaArmeniaArubaAustraliaAustriaAzerbaijanBahamas, TheBahrainBangladeshBarbadosBelarusBelgiumBelizeBeninBermudaBoliviaBosnia and HerzegovinaBotswanaBrazilBritish Virgin IslandsBrunei DarussalamBulgariaBurkina FasoBurundiCabo VerdeCambodiaCameroonCanadaCaribbean small statesCayman IslandsCentral African RepublicCentral Europe and the BalticsChadChileChinaColombiaComorosCongo, Dem. Rep.Congo, Rep.Costa RicaCote d'IvoireCroatiaCuracaoCyprusCzech RepublicDenmarkDominicaDominican RepublicEarly-demographic dividendEast Asia & PacificEast Asia & Pacific (excluding high income)East Asia & Pacific (IDA & IBRD countries)EcuadorEgypt, Arab Rep.El SalvadorEquatorial GuineaEritreaEstoniaEuro areaEurope & Central AsiaEurope & Central Asia (excluding high income)Europe & Central Asia (IDA & IBRD countries)European UnionFijiFinlandFragile and conflict affected situationsFranceFrench PolynesiaGabonGambia, TheGeorgiaGermanyGhanaGreeceGrenadaGuatemalaGuineaGuinea-BissauGuyanaHaitiHeavily indebted poor countries (HIPC)High incomeHondurasHong Kong SAR, ChinaHungaryIBRD onlyIcelandIDA & IBRD totalIDA blendIDA onlyIDA totalIndiaIndonesiaIran, Islamic Rep.IraqIrelandIsraelItalyJamaicaJapanJordanKazakhstanKenyaKiribatiKorea, Dem. People’s Rep.Korea, Rep.KosovoKuwaitKyrgyz RepublicLao PDRLate-demographic dividendLatin America & Caribbean Latin America & Caribbean (excluding high income)Latin America & the Caribbean (IDA & IBRD countries)LatviaLeast developed countries: UN classificationLebanonLesothoLiberiaLibyaLithuaniaLow & middle incomeLow incomeLower middle incomeLuxembourgMacao SAR, ChinaMacedonia, FYRMadagascarMalawiMalaysiaMaliMaltaMarshall IslandsMauritaniaMauritiusMexicoMicronesia, Fed. Sts.Middle East & North AfricaMiddle East & North Africa (excluding high income)Middle East & North Africa (IDA & IBRD countries)Middle incomeMoldovaMongoliaMontenegroMoroccoMozambiqueNamibiaNauruNetherlandsNew CaledoniaNew ZealandNicaraguaNigerNigeriaNorth AmericaNorthern Mariana IslandsNorwayOECD membersOmanOther small statesPacific island small statesPakistanPalauPanamaPapua New GuineaParaguayPeruPhilippinesPolandPortugalPost-demographic dividendPre-demographic dividendQatarRomaniaRussian FederationRwandaSamoaSao Tome and PrincipeSaudi ArabiaSenegalSerbiaSeychellesSierra LeoneSingaporeSint Maarten (Dutch part)Slovak RepublicSloveniaSmall statesSolomon IslandsSouth AfricaSouth AsiaSouth Asia (IDA & IBRD)SpainSri LankaSt. Kitts and NevisSt. LuciaSt. Vincent and the GrenadinesSub-Saharan Africa Sub-Saharan Africa (excluding high income)Sub-Saharan Africa (IDA & IBRD countries)SurinameSwazilandSwedenSwitzerlandSyrian Arab RepublicTajikistanTanzaniaThailandTimor-LesteTogoTongaTrinidad and TobagoTunisiaTurkeyUgandaUkraineUnited Arab EmiratesUnited KingdomUnited StatesUpper middle incomeUruguayVanuatuVenezuela, RBVietnamWest Bank and GazaWorldYemen, Rep.ZambiaZimbabwe La ligne de temps
Cette échelle de temps montre un graphique de 1977 année à 2016 année Poland. Les données jusqu'à 1976 année ne sont pas présentés. Quantité d'observations actuelles selon dates: 40.
Source (désignation):
Les indicateurs du développement mondiale
Source (organisation):
International Monetary Fund, Balance of Payments database, supplemented by data from the United Nations Conference on Trade and Development and official national sources.
Catégories:
Economy & Growth, Financial Sector
Dernière mise à jour
23 avr. 2017
Les indicateurs de changement de valeurs selon les années
Minimum:
-3.411 mds
1 janv. 2014
Maximum:
10.803 mds
1 janv. 2007
Pour la date d''observation
Valeur
Changement absolu
Le changement par rapport à la valeur précédente
1 janv. 1977
12.0 mln.
+12.0 mln.
0.0%
1 janv. 1978
17.0 mln.
+5.0 mln.
41.67%
1 janv. 1979
16.0 mln.
-1000.0 milles
-5.88%
1 janv. 1980
13.0 mln.
-3.0 mln.
-18.75%
1 janv. 1981
21.0 mln.
+8.0 mln.
61.54%
1 janv. 1982
3.0 mln.
-18.0 mln.
-85.71%
1 janv. 1983
4.0 mln.
+1000.0 milles
33.33%
1 janv. 1984
1000.0 milles
-3.0 mln.
-75.0%
1 janv. 1985
12.0 mln.
+11.0 mln.
1.1 milles%
1 janv. 1986
1000.0 milles
-11.0 mln.
-91.67%
1 janv. 1987
22.0 mln.
+21.0 mln.
2.1 milles%
1 janv. 1988
8.0 mln.
-14.0 mln.
-63.64%
1 janv. 1989
22.0 mln.
+14.0 mln.
175.0%
1 janv. 1990
18.0 mln.
-4.0 mln.
-18.18%
1 janv. 1991
5.357 mln.
-12.643 mln.
-70.24%
1 janv. 1992
-7.0 mln.
-12.357 mln.
-230.67%
1 janv. 1993
13.0 mln.
+20.0 mln.
-285.71%
1 janv. 1994
18.0 mln.
+5.0 mln.
38.46%
1 janv. 1995
29.0 mln.
+11.0 mln.
61.11%
1 janv. 1996
42.0 mln.
+13.0 mln.
44.83%
1 janv. 1997
55.0 mln.
+13.0 mln.
30.95%
1 janv. 1998
47.0 mln.
-8.0 mln.
-14.55%
1 janv. 1999
334.0 mln.
+287.0 mln.
610.64%
1 janv. 2000
168.0 mln.
-166.0 mln.
-49.7%
1 janv. 2001
8.0 mln.
-160.0 mln.
-95.24%
1 janv. 2002
-127.0 mln.
-135.0 mln.
-1.69 milles%
1 janv. 2003
190.0 mln.
+317.0 mln.
-249.61%
1 janv. 2004
1.087 mds
+897.0 mln.
472.11%
1 janv. 2005
2.139 mds
+1.052 mds
96.78%
1 janv. 2006
4.134 mds
+1.995 mds
93.27%
1 janv. 2007
10.803 mds
+6.669 mds
161.32%
1 janv. 2008
7.586 mds
-3.217 mds
-29.78%
1 janv. 2009
4.666 mds
-2.92 mds
-38.49%
1 janv. 2010
5.931 mds
+1.265 mds
27.11%
1 janv. 2011
9.516 mds
+3.585 mds
60.45%
1 janv. 2012
4.815 mds
-4.701 mds
-49.4%
1 janv. 2013
1.327 mds
-3.488 mds
-72.44%
1 janv. 2014
-3.411 mds
-4.738 mds
-357.05%
1 janv. 2015
6.799 mds
+10.21 mds
-299.33%
1 janv. 2016
4.252 mds
-2.547 mds
-37.46%
Classement des pays selon les statistiques actuelles par années


Commentaires: