29
/fr/
fr
AIzaSyAYiBZKx7MnpbEhh9jyipgxe19OcubqV5w
April 1, 2024
44557
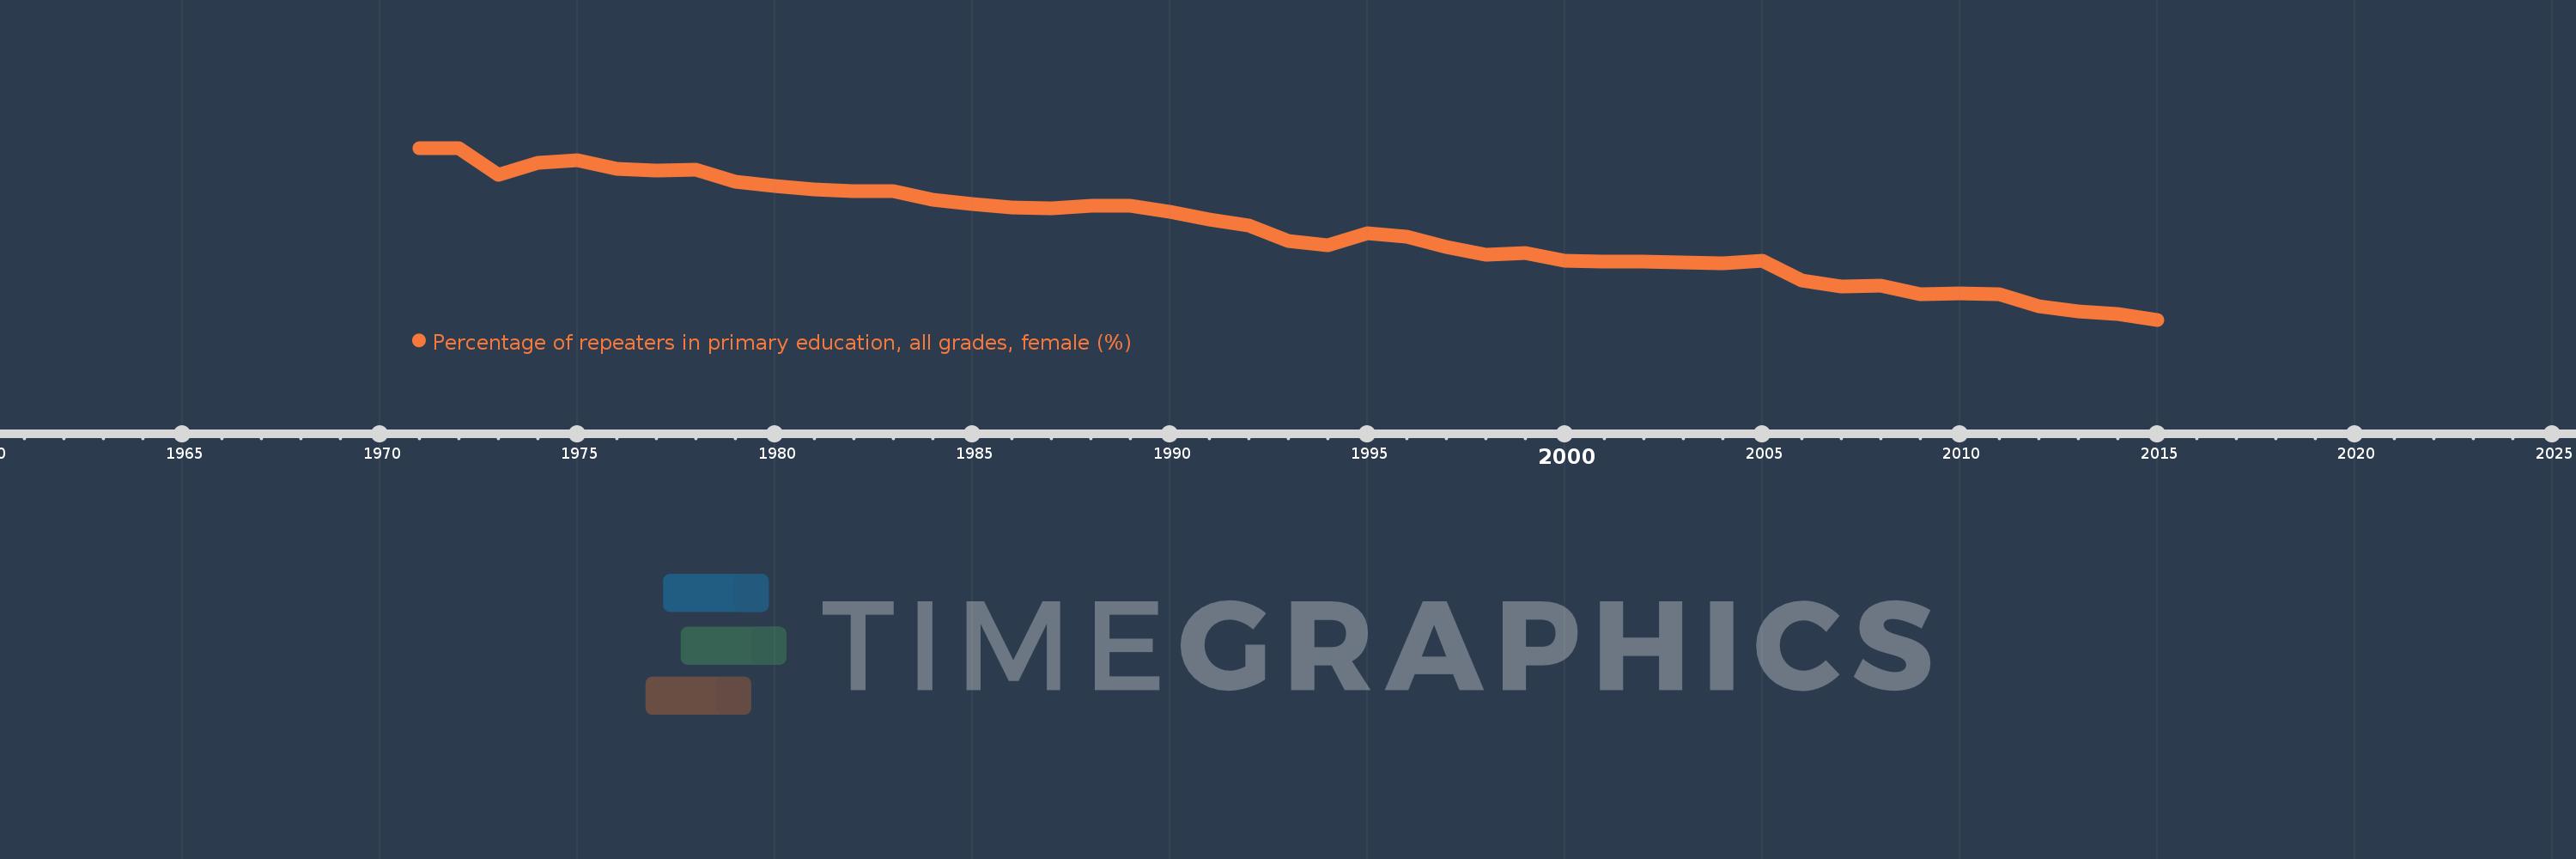
Least developed countries: UN classification
LDC
false
2
1
Percentage of repeaters in primary education, all grades, female (%)
2015,2014,2013,2012,2011,2010,2009,2008,2007,2006,2005,2004,2003,2002,2001,2000,1999,1998,1997,1996,1995,1994,1993,1992,1991,1990,1989,1988,1987,1986,1985,1984,1983,1982,1981,1980,1979,1978,1977,1976,1975,1974,1973,1972,1971
Cette statistique dans les autres pays:
AfghanistanAlbaniaAlgeriaAndorraAngolaAntigua and BarbudaArab WorldArgentinaArmeniaArubaAustriaAzerbaijanBahamas, TheBahrainBangladeshBelarusBelgiumBelizeBeninBermudaBhutanBoliviaBosnia and HerzegovinaBotswanaBrazilBritish Virgin IslandsBrunei DarussalamBulgariaBurkina FasoBurundiCabo VerdeCambodiaCameroonCanadaCaribbean small statesCayman IslandsCentral African RepublicCentral Europe and the BalticsChadChileChinaColombiaComorosCongo, Dem. Rep.Congo, Rep.Costa RicaCote d'IvoireCroatiaCubaCyprusCzech RepublicDenmarkDjiboutiDominicaDominican RepublicEarly-demographic dividendEast Asia & PacificEast Asia & Pacific (excluding high income)East Asia & Pacific (IDA & IBRD countries)EcuadorEgypt, Arab Rep.El SalvadorEquatorial GuineaEritreaEstoniaEthiopiaEuro areaEurope & Central AsiaEurope & Central Asia (excluding high income)Europe & Central Asia (IDA & IBRD countries)European UnionFijiFinlandFragile and conflict affected situationsFranceGabonGambia, TheGeorgiaGermanyGhanaGreeceGrenadaGuatemalaGuineaGuinea-BissauGuyanaHaitiHeavily indebted poor countries (HIPC)High incomeHondurasHong Kong SAR, ChinaHungaryIBRD onlyIcelandIDA & IBRD totalIDA blendIDA onlyIDA totalIndiaIndonesiaIran, Islamic Rep.IraqIrelandIsraelItalyJamaicaJapanJordanKazakhstanKenyaKiribatiKorea, Rep.KuwaitKyrgyz RepublicLao PDRLate-demographic dividendLatin America & Caribbean Latin America & Caribbean (excluding high income)Latin America & the Caribbean (IDA & IBRD countries)LatviaLeast developed countries: UN classificationLebanonLesothoLiberiaLibyaLiechtensteinLithuaniaLow & middle incomeLow incomeLower middle incomeLuxembourgMacao SAR, ChinaMacedonia, FYRMadagascarMalawiMalaysiaMaldivesMaliMaltaMauritaniaMauritiusMexicoMiddle East & North AfricaMiddle East & North Africa (excluding high income)Middle East & North Africa (IDA & IBRD countries)Middle incomeMoldovaMonacoMongoliaMontenegroMoroccoMozambiqueMyanmarNamibiaNauruNepalNetherlandsNew ZealandNicaraguaNigerNorwayOECD membersOmanOther small statesPacific island small statesPakistanPalauPanamaPapua New GuineaParaguayPeruPhilippinesPolandPortugalPost-demographic dividendPre-demographic dividendQatarRomaniaRussian FederationRwandaSamoaSan MarinoSao Tome and PrincipeSaudi ArabiaSenegalSerbiaSeychellesSierra LeoneSingaporeSint Maarten (Dutch part)Slovak RepublicSloveniaSmall statesSolomon IslandsSomaliaSouth AfricaSouth AsiaSouth Asia (IDA & IBRD)South SudanSpainSri LankaSt. Kitts and NevisSt. LuciaSt. Vincent and the GrenadinesSub-Saharan Africa Sub-Saharan Africa (excluding high income)Sub-Saharan Africa (IDA & IBRD countries)SudanSurinameSwazilandSwedenSwitzerlandSyrian Arab RepublicTajikistanTanzaniaThailandTimor-LesteTogoTongaTrinidad and TobagoTunisiaTurkeyTurks and Caicos IslandsTuvaluUgandaUkraineUnited Arab EmiratesUnited KingdomUpper middle incomeUruguayUzbekistanVanuatuVenezuela, RBVietnamWest Bank and GazaWorldYemen, Rep.ZambiaZimbabwe La ligne de temps
Cette échelle de temps montre un graphique de 1971 année à 2015 année Least developed countries: UN classification. Les données jusqu'à 1970 année ne sont pas présentés. Quantité d'observations actuelles selon dates: 45.
Source (désignation):
Les indicateurs du développement mondiale
Source (organisation):
UNESCO Institute for Statistics
Catégories:
Education, Gender
Dernière mise à jour
23 avr. 2017
Les indicateurs de changement de valeurs selon les années
Minimum:
9.467
1 janv. 2015
Maximum:
17.515
1 janv. 1971
Pour la date d''observation
Valeur
Changement absolu
Le changement par rapport à la valeur précédente
1 janv. 1971
17.515
+17.515
0.0%
1 janv. 1972
17.486
-0.03
-0.17%
1 janv. 1973
16.244
-1.242
-7.1%
1 janv. 1974
16.824
+0.58
3.57%
1 janv. 1975
16.939
+0.115
0.68%
1 janv. 1976
16.549
-0.39
-2.31%
1 janv. 1977
16.439
-0.109
-0.66%
1 janv. 1978
16.48
+0.041
0.25%
1 janv. 1979
15.942
-0.538
-3.26%
1 janv. 1980
15.725
-0.218
-1.37%
1 janv. 1981
15.564
-0.161
-1.02%
1 janv. 1982
15.484
-0.079
-0.51%
1 janv. 1983
15.482
-0.003
-0.02%
1 janv. 1984
15.098
-0.384
-2.48%
1 janv. 1985
14.892
-0.206
-1.36%
1 janv. 1986
14.729
-0.163
-1.1%
1 janv. 1987
14.673
-0.055
-0.38%
1 janv. 1988
14.821
+0.148
1.01%
1 janv. 1989
14.82
-0.002
-0.01%
1 janv. 1990
14.538
-0.282
-1.9%
1 janv. 1991
14.151
-0.387
-2.66%
1 janv. 1992
13.897
-0.254
-1.79%
1 janv. 1993
13.149
-0.748
-5.38%
1 janv. 1994
12.95
-0.2
-1.52%
1 janv. 1995
13.513
+0.563
4.35%
1 janv. 1996
13.347
-0.166
-1.23%
1 janv. 1997
12.883
-0.464
-3.48%
1 janv. 1998
12.508
-0.375
-2.91%
1 janv. 1999
12.574
+0.066
0.53%
1 janv. 2000
12.22
-0.354
-2.81%
1 janv. 2001
12.176
-0.044
-0.36%
1 janv. 2002
12.196
+0.021
0.17%
1 janv. 2003
12.16
-0.036
-0.3%
1 janv. 2004
12.126
-0.034
-0.28%
1 janv. 2005
12.235
+0.11
0.9%
1 janv. 2006
11.322
-0.913
-7.46%
1 janv. 2007
11.019
-0.304
-2.68%
1 janv. 2008
11.079
+0.06
0.54%
1 janv. 2009
10.679
-0.399
-3.6%
1 janv. 2010
10.711
+0.032
0.29%
1 janv. 2011
10.658
-0.053
-0.5%
1 janv. 2012
10.103
-0.555
-5.2%
1 janv. 2013
9.863
-0.24
-2.37%
1 janv. 2014
9.744
-0.119
-1.21%
1 janv. 2015
9.467
-0.277
-2.84%
Classement des pays selon les statistiques actuelles par années


Commentaires: