29
/fr/
fr
AIzaSyAYiBZKx7MnpbEhh9jyipgxe19OcubqV5w
April 1, 2024
146104
Guinea
GIN
true
2
1
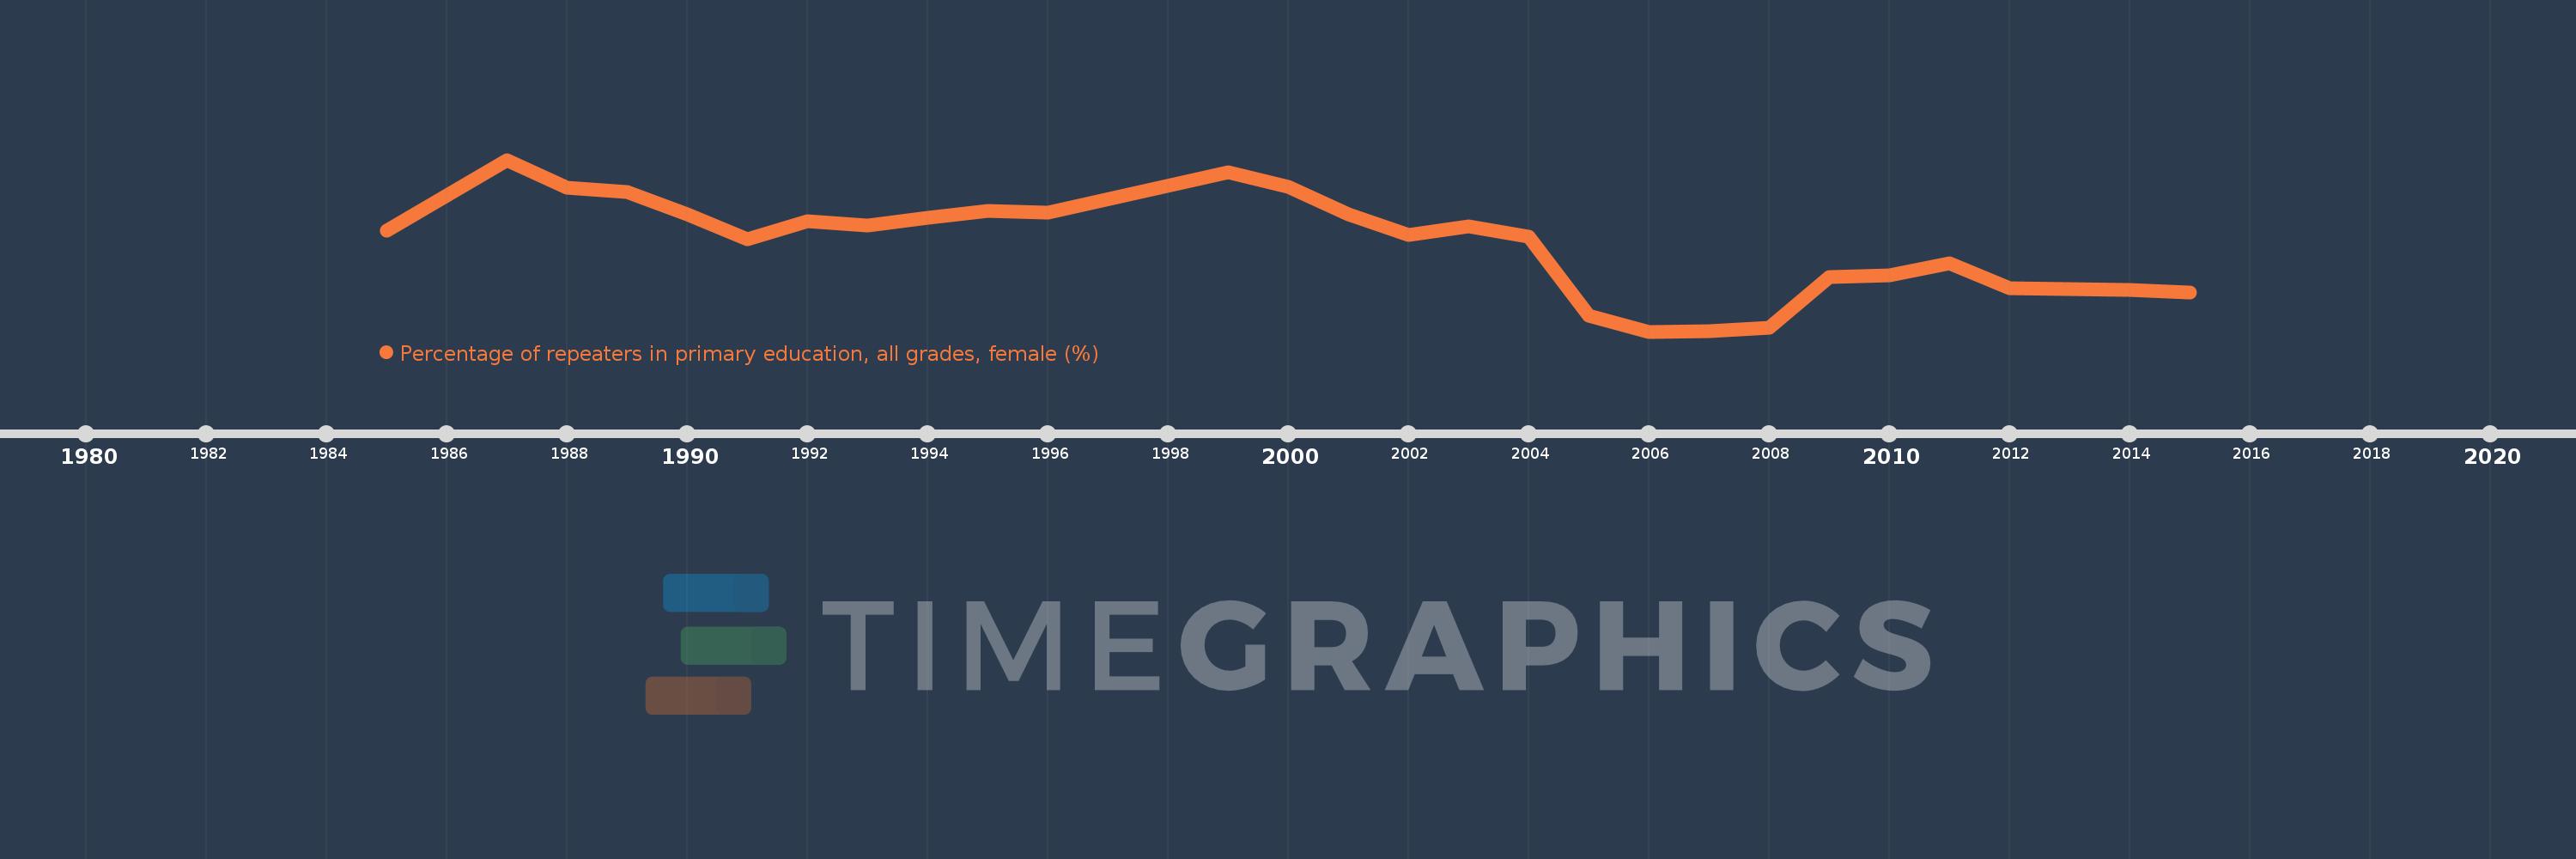
Percentage of repeaters in primary education, all grades, female (%)
2015,2014,2013,2012,2011,2010,2009,2008,2007,2006,2005,2004,2003,2002,2001,2000,1999,1996,1995,1994,1993,1992,1991,1990,1989,1988,1987,1986,1985
Cette statistique dans les autres pays:
AfghanistanAlbaniaAlgeriaAndorraAngolaAntigua and BarbudaArab WorldArgentinaArmeniaArubaAustriaAzerbaijanBahamas, TheBahrainBangladeshBelarusBelgiumBelizeBeninBermudaBhutanBoliviaBosnia and HerzegovinaBotswanaBrazilBritish Virgin IslandsBrunei DarussalamBulgariaBurkina FasoBurundiCabo VerdeCambodiaCameroonCanadaCaribbean small statesCayman IslandsCentral African RepublicCentral Europe and the BalticsChadChileChinaColombiaComorosCongo, Dem. Rep.Congo, Rep.Costa RicaCote d'IvoireCroatiaCubaCyprusCzech RepublicDenmarkDjiboutiDominicaDominican RepublicEarly-demographic dividendEast Asia & PacificEast Asia & Pacific (excluding high income)East Asia & Pacific (IDA & IBRD countries)EcuadorEgypt, Arab Rep.El SalvadorEquatorial GuineaEritreaEstoniaEthiopiaEuro areaEurope & Central AsiaEurope & Central Asia (excluding high income)Europe & Central Asia (IDA & IBRD countries)European UnionFijiFinlandFragile and conflict affected situationsFranceGabonGambia, TheGeorgiaGermanyGhanaGreeceGrenadaGuatemalaGuineaGuinea-BissauGuyanaHaitiHeavily indebted poor countries (HIPC)High incomeHondurasHong Kong SAR, ChinaHungaryIBRD onlyIcelandIDA & IBRD totalIDA blendIDA onlyIDA totalIndiaIndonesiaIran, Islamic Rep.IraqIrelandIsraelItalyJamaicaJapanJordanKazakhstanKenyaKiribatiKorea, Rep.KuwaitKyrgyz RepublicLao PDRLate-demographic dividendLatin America & Caribbean Latin America & Caribbean (excluding high income)Latin America & the Caribbean (IDA & IBRD countries)LatviaLeast developed countries: UN classificationLebanonLesothoLiberiaLibyaLiechtensteinLithuaniaLow & middle incomeLow incomeLower middle incomeLuxembourgMacao SAR, ChinaMacedonia, FYRMadagascarMalawiMalaysiaMaldivesMaliMaltaMauritaniaMauritiusMexicoMiddle East & North AfricaMiddle East & North Africa (excluding high income)Middle East & North Africa (IDA & IBRD countries)Middle incomeMoldovaMonacoMongoliaMontenegroMoroccoMozambiqueMyanmarNamibiaNauruNepalNetherlandsNew ZealandNicaraguaNigerNorwayOECD membersOmanOther small statesPacific island small statesPakistanPalauPanamaPapua New GuineaParaguayPeruPhilippinesPolandPortugalPost-demographic dividendPre-demographic dividendQatarRomaniaRussian FederationRwandaSamoaSan MarinoSao Tome and PrincipeSaudi ArabiaSenegalSerbiaSeychellesSierra LeoneSingaporeSint Maarten (Dutch part)Slovak RepublicSloveniaSmall statesSolomon IslandsSomaliaSouth AfricaSouth AsiaSouth Asia (IDA & IBRD)South SudanSpainSri LankaSt. Kitts and NevisSt. LuciaSt. Vincent and the GrenadinesSub-Saharan Africa Sub-Saharan Africa (excluding high income)Sub-Saharan Africa (IDA & IBRD countries)SudanSurinameSwazilandSwedenSwitzerlandSyrian Arab RepublicTajikistanTanzaniaThailandTimor-LesteTogoTongaTrinidad and TobagoTunisiaTurkeyTurks and Caicos IslandsTuvaluUgandaUkraineUnited Arab EmiratesUnited KingdomUpper middle incomeUruguayUzbekistanVanuatuVenezuela, RBVietnamWest Bank and GazaWorldYemen, Rep.ZambiaZimbabwe La ligne de temps
Cette échelle de temps montre un graphique de 1985 année à 2015 année Guinea. Les données jusqu'à 1984 année ne sont pas présentés. Quantité d'observations actuelles selon dates: 29.
Source (désignation):
Les indicateurs du développement mondiale
Source (organisation):
UNESCO Institute for Statistics
Catégories:
Education, Gender
Dernière mise à jour
23 avr. 2017
Les indicateurs de changement de valeurs selon les années
Minimum:
8.964
1 janv. 2006
Maximum:
30.821
1 janv. 1987
Pour la date d''observation
Valeur
Changement absolu
Le changement par rapport à la valeur précédente
1 janv. 1985
21.788
+21.788
0.0%
1 janv. 1986
26.268
+4.48
20.56%
1 janv. 1987
30.821
+4.553
17.33%
1 janv. 1988
27.323
-3.498
-11.35%
1 janv. 1989
26.752
-0.571
-2.09%
1 janv. 1990
23.896
-2.856
-10.68%
1 janv. 1991
20.727
-3.169
-13.26%
1 janv. 1992
22.966
+2.24
10.81%
1 janv. 1993
22.472
-0.494
-2.15%
1 janv. 1994
23.402
+0.929
4.13%
1 janv. 1995
24.36
+0.958
4.1%
1 janv. 1996
24.085
-0.275
-1.13%
1 janv. 1999
29.242
+5.158
21.41%
1 janv. 2000
27.356
-1.887
-6.45%
1 janv. 2001
23.927
-3.429
-12.53%
1 janv. 2002
21.211
-2.716
-11.35%
1 janv. 2003
22.375
+1.164
5.49%
1 janv. 2004
21.013
-1.362
-6.09%
1 janv. 2005
10.998
-10.015
-47.66%
1 janv. 2006
8.964
-2.034
-18.5%
1 janv. 2007
9.05
+0.086
0.96%
1 janv. 2008
9.509
+0.459
5.07%
1 janv. 2009
15.897
+6.388
67.18%
1 janv. 2010
16.109
+0.212
1.34%
1 janv. 2011
17.642
+1.533
9.52%
1 janv. 2012
14.489
-3.153
-17.87%
1 janv. 2013
14.427
-0.062
-0.43%
1 janv. 2014
14.3
-0.126
-0.88%
1 janv. 2015
13.895
-0.405
-2.83%
Classement des pays selon les statistiques actuelles par années


Commentaires: