29
/fr/
fr
AIzaSyAYiBZKx7MnpbEhh9jyipgxe19OcubqV5w
April 1, 2024
34511
Fragile and conflict affected situations
FCS
false
2
1
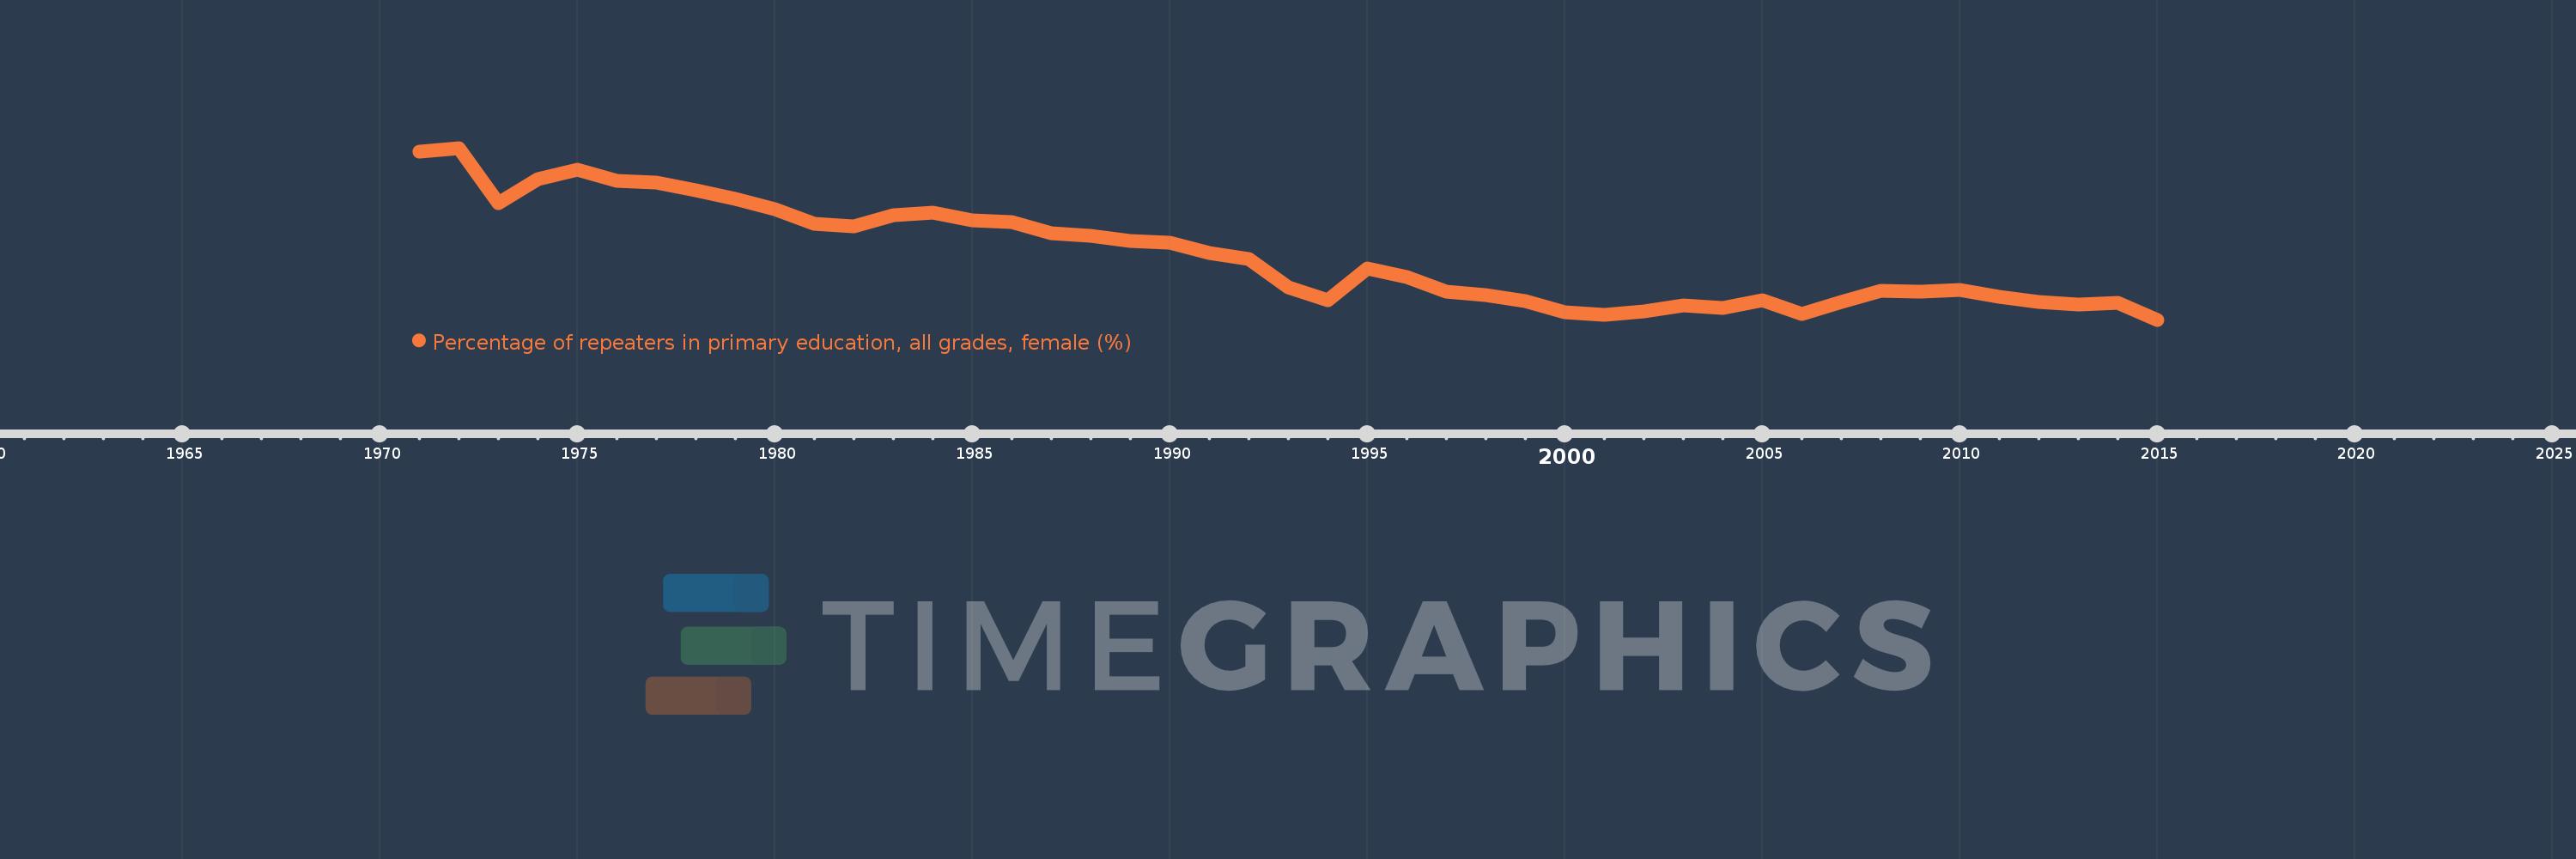
Percentage of repeaters in primary education, all grades, female (%)
2015,2014,2013,2012,2011,2010,2009,2008,2007,2006,2005,2004,2003,2002,2001,2000,1999,1998,1997,1996,1995,1994,1993,1992,1991,1990,1989,1988,1987,1986,1985,1984,1983,1982,1981,1980,1979,1978,1977,1976,1975,1974,1973,1972,1971
Cette statistique dans les autres pays:
AfghanistanAlbaniaAlgeriaAndorraAngolaAntigua and BarbudaArab WorldArgentinaArmeniaArubaAustriaAzerbaijanBahamas, TheBahrainBangladeshBelarusBelgiumBelizeBeninBermudaBhutanBoliviaBosnia and HerzegovinaBotswanaBrazilBritish Virgin IslandsBrunei DarussalamBulgariaBurkina FasoBurundiCabo VerdeCambodiaCameroonCanadaCaribbean small statesCayman IslandsCentral African RepublicCentral Europe and the BalticsChadChileChinaColombiaComorosCongo, Dem. Rep.Congo, Rep.Costa RicaCote d'IvoireCroatiaCubaCyprusCzech RepublicDenmarkDjiboutiDominicaDominican RepublicEarly-demographic dividendEast Asia & PacificEast Asia & Pacific (excluding high income)East Asia & Pacific (IDA & IBRD countries)EcuadorEgypt, Arab Rep.El SalvadorEquatorial GuineaEritreaEstoniaEthiopiaEuro areaEurope & Central AsiaEurope & Central Asia (excluding high income)Europe & Central Asia (IDA & IBRD countries)European UnionFijiFinlandFragile and conflict affected situationsFranceGabonGambia, TheGeorgiaGermanyGhanaGreeceGrenadaGuatemalaGuineaGuinea-BissauGuyanaHaitiHeavily indebted poor countries (HIPC)High incomeHondurasHong Kong SAR, ChinaHungaryIBRD onlyIcelandIDA & IBRD totalIDA blendIDA onlyIDA totalIndiaIndonesiaIran, Islamic Rep.IraqIrelandIsraelItalyJamaicaJapanJordanKazakhstanKenyaKiribatiKorea, Rep.KuwaitKyrgyz RepublicLao PDRLate-demographic dividendLatin America & Caribbean Latin America & Caribbean (excluding high income)Latin America & the Caribbean (IDA & IBRD countries)LatviaLeast developed countries: UN classificationLebanonLesothoLiberiaLibyaLiechtensteinLithuaniaLow & middle incomeLow incomeLower middle incomeLuxembourgMacao SAR, ChinaMacedonia, FYRMadagascarMalawiMalaysiaMaldivesMaliMaltaMauritaniaMauritiusMexicoMiddle East & North AfricaMiddle East & North Africa (excluding high income)Middle East & North Africa (IDA & IBRD countries)Middle incomeMoldovaMonacoMongoliaMontenegroMoroccoMozambiqueMyanmarNamibiaNauruNepalNetherlandsNew ZealandNicaraguaNigerNorwayOECD membersOmanOther small statesPacific island small statesPakistanPalauPanamaPapua New GuineaParaguayPeruPhilippinesPolandPortugalPost-demographic dividendPre-demographic dividendQatarRomaniaRussian FederationRwandaSamoaSan MarinoSao Tome and PrincipeSaudi ArabiaSenegalSerbiaSeychellesSierra LeoneSingaporeSint Maarten (Dutch part)Slovak RepublicSloveniaSmall statesSolomon IslandsSomaliaSouth AfricaSouth AsiaSouth Asia (IDA & IBRD)South SudanSpainSri LankaSt. Kitts and NevisSt. LuciaSt. Vincent and the GrenadinesSub-Saharan Africa Sub-Saharan Africa (excluding high income)Sub-Saharan Africa (IDA & IBRD countries)SudanSurinameSwazilandSwedenSwitzerlandSyrian Arab RepublicTajikistanTanzaniaThailandTimor-LesteTogoTongaTrinidad and TobagoTunisiaTurkeyTurks and Caicos IslandsTuvaluUgandaUkraineUnited Arab EmiratesUnited KingdomUpper middle incomeUruguayUzbekistanVanuatuVenezuela, RBVietnamWest Bank and GazaWorldYemen, Rep.ZambiaZimbabwe La ligne de temps
Cette échelle de temps montre un graphique de 1971 année à 2015 année Fragile and conflict affected situations. Les données jusqu'à 1970 année ne sont pas présentés. Quantité d'observations actuelles selon dates: 45.
Source (désignation):
Les indicateurs du développement mondiale
Source (organisation):
UNESCO Institute for Statistics
Catégories:
Education, Gender
Dernière mise à jour
23 avr. 2017
Les indicateurs de changement de valeurs selon les années
Minimum:
10.681
1 janv. 2015
Maximum:
16.762
1 janv. 1972
Pour la date d''observation
Valeur
Changement absolu
Le changement par rapport à la valeur précédente
1 janv. 1971
16.635
+16.635
0.0%
1 janv. 1972
16.762
+0.127
0.76%
1 janv. 1973
14.811
-1.951
-11.64%
1 janv. 1974
15.664
+0.853
5.76%
1 janv. 1975
15.985
+0.321
2.05%
1 janv. 1976
15.587
-0.398
-2.49%
1 janv. 1977
15.54
-0.047
-0.3%
1 janv. 1978
15.254
-0.286
-1.84%
1 janv. 1979
14.962
-0.292
-1.92%
1 janv. 1980
14.593
-0.369
-2.47%
1 janv. 1981
14.07
-0.523
-3.58%
1 janv. 1982
13.978
-0.092
-0.66%
1 janv. 1983
14.38
+0.402
2.88%
1 janv. 1984
14.471
+0.091
0.64%
1 janv. 1985
14.205
-0.266
-1.84%
1 janv. 1986
14.135
-0.069
-0.49%
1 janv. 1987
13.74
-0.395
-2.8%
1 janv. 1988
13.64
-0.1
-0.73%
1 janv. 1989
13.474
-0.166
-1.22%
1 janv. 1990
13.399
-0.075
-0.56%
1 janv. 1991
13.049
-0.35
-2.61%
1 janv. 1992
12.829
-0.22
-1.69%
1 janv. 1993
11.816
-1.013
-7.9%
1 janv. 1994
11.376
-0.44
-3.72%
1 janv. 1995
12.491
+1.115
9.8%
1 janv. 1996
12.195
-0.296
-2.37%
1 janv. 1997
11.674
-0.522
-4.28%
1 janv. 1998
11.566
-0.108
-0.93%
1 janv. 1999
11.331
-0.235
-2.03%
1 janv. 2000
10.957
-0.374
-3.3%
1 janv. 2001
10.862
-0.095
-0.87%
1 janv. 2002
10.985
+0.123
1.13%
1 janv. 2003
11.183
+0.198
1.81%
1 janv. 2004
11.093
-0.09
-0.81%
1 janv. 2005
11.361
+0.269
2.42%
1 janv. 2006
10.888
-0.473
-4.16%
1 janv. 2007
11.314
+0.426
3.91%
1 janv. 2008
11.694
+0.38
3.36%
1 janv. 2009
11.674
-0.021
-0.18%
1 janv. 2010
11.729
+0.055
0.47%
1 janv. 2011
11.485
-0.243
-2.08%
1 janv. 2012
11.311
-0.175
-1.52%
1 janv. 2013
11.219
-0.092
-0.81%
1 janv. 2014
11.27
+0.051
0.45%
1 janv. 2015
10.681
-0.588
-5.22%
Classement des pays selon les statistiques actuelles par années


Commentaires: