29
/fr/
fr
AIzaSyAYiBZKx7MnpbEhh9jyipgxe19OcubqV5w
April 1, 2024
286349
Zambia
ZMB
true
2
1
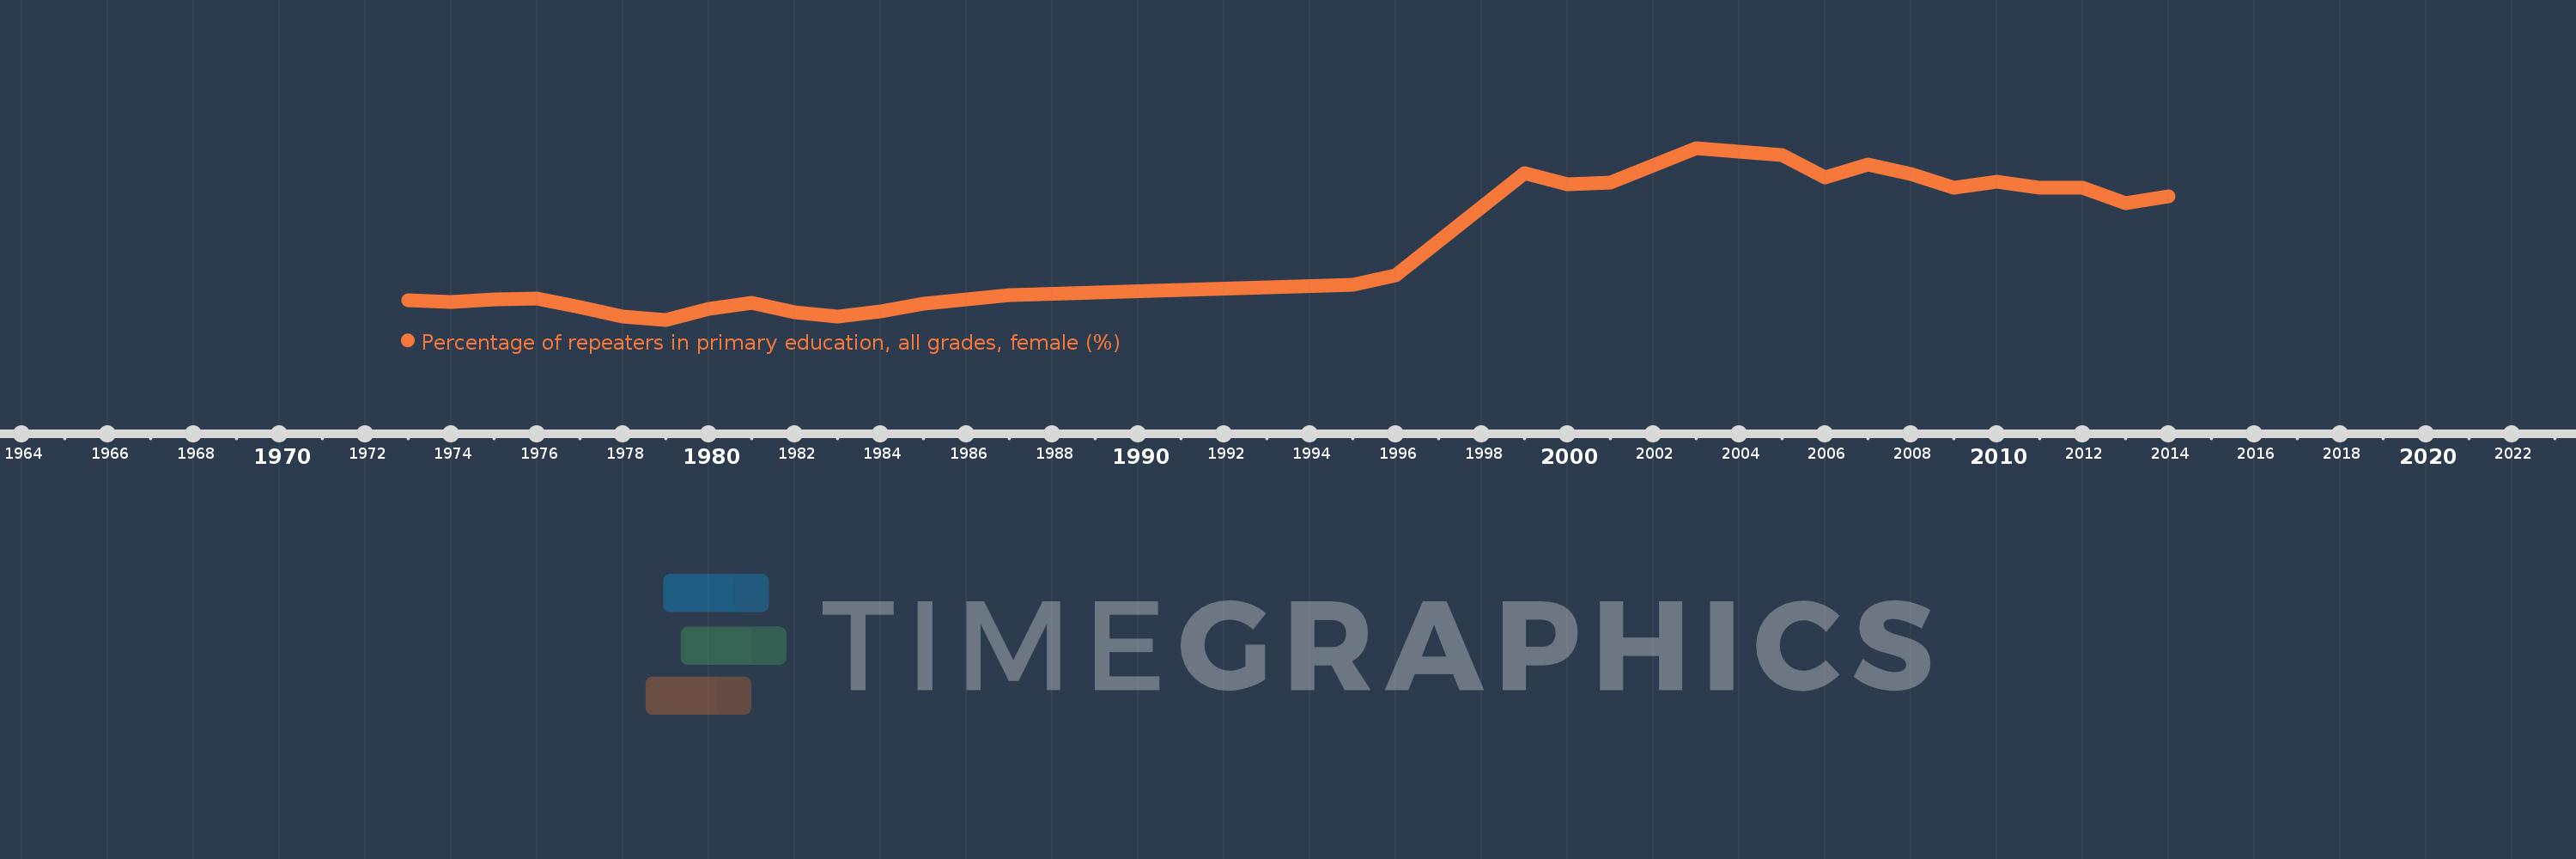
Percentage of repeaters in primary education, all grades, female (%)
2014,2013,2012,2011,2010,2009,2008,2007,2006,2005,2003,2001,2000,1999,1996,1995,1987,1985,1984,1983,1982,1981,1980,1979,1978,1977,1976,1975,1974,1973
Cette statistique dans les autres pays:
AfghanistanAlbaniaAlgeriaAndorraAngolaAntigua and BarbudaArab WorldArgentinaArmeniaArubaAustriaAzerbaijanBahamas, TheBahrainBangladeshBelarusBelgiumBelizeBeninBermudaBhutanBoliviaBosnia and HerzegovinaBotswanaBrazilBritish Virgin IslandsBrunei DarussalamBulgariaBurkina FasoBurundiCabo VerdeCambodiaCameroonCanadaCaribbean small statesCayman IslandsCentral African RepublicCentral Europe and the BalticsChadChileChinaColombiaComorosCongo, Dem. Rep.Congo, Rep.Costa RicaCote d'IvoireCroatiaCubaCyprusCzech RepublicDenmarkDjiboutiDominicaDominican RepublicEarly-demographic dividendEast Asia & PacificEast Asia & Pacific (excluding high income)East Asia & Pacific (IDA & IBRD countries)EcuadorEgypt, Arab Rep.El SalvadorEquatorial GuineaEritreaEstoniaEthiopiaEuro areaEurope & Central AsiaEurope & Central Asia (excluding high income)Europe & Central Asia (IDA & IBRD countries)European UnionFijiFinlandFragile and conflict affected situationsFranceGabonGambia, TheGeorgiaGermanyGhanaGreeceGrenadaGuatemalaGuineaGuinea-BissauGuyanaHaitiHeavily indebted poor countries (HIPC)High incomeHondurasHong Kong SAR, ChinaHungaryIBRD onlyIcelandIDA & IBRD totalIDA blendIDA onlyIDA totalIndiaIndonesiaIran, Islamic Rep.IraqIrelandIsraelItalyJamaicaJapanJordanKazakhstanKenyaKiribatiKorea, Rep.KuwaitKyrgyz RepublicLao PDRLate-demographic dividendLatin America & Caribbean Latin America & Caribbean (excluding high income)Latin America & the Caribbean (IDA & IBRD countries)LatviaLeast developed countries: UN classificationLebanonLesothoLiberiaLibyaLiechtensteinLithuaniaLow & middle incomeLow incomeLower middle incomeLuxembourgMacao SAR, ChinaMacedonia, FYRMadagascarMalawiMalaysiaMaldivesMaliMaltaMauritaniaMauritiusMexicoMiddle East & North AfricaMiddle East & North Africa (excluding high income)Middle East & North Africa (IDA & IBRD countries)Middle incomeMoldovaMonacoMongoliaMontenegroMoroccoMozambiqueMyanmarNamibiaNauruNepalNetherlandsNew ZealandNicaraguaNigerNorwayOECD membersOmanOther small statesPacific island small statesPakistanPalauPanamaPapua New GuineaParaguayPeruPhilippinesPolandPortugalPost-demographic dividendPre-demographic dividendQatarRomaniaRussian FederationRwandaSamoaSan MarinoSao Tome and PrincipeSaudi ArabiaSenegalSerbiaSeychellesSierra LeoneSingaporeSint Maarten (Dutch part)Slovak RepublicSloveniaSmall statesSolomon IslandsSomaliaSouth AfricaSouth AsiaSouth Asia (IDA & IBRD)South SudanSpainSri LankaSt. Kitts and NevisSt. LuciaSt. Vincent and the GrenadinesSub-Saharan Africa Sub-Saharan Africa (excluding high income)Sub-Saharan Africa (IDA & IBRD countries)SudanSurinameSwazilandSwedenSwitzerlandSyrian Arab RepublicTajikistanTanzaniaThailandTimor-LesteTogoTongaTrinidad and TobagoTunisiaTurkeyTurks and Caicos IslandsTuvaluUgandaUkraineUnited Arab EmiratesUnited KingdomUpper middle incomeUruguayUzbekistanVanuatuVenezuela, RBVietnamWest Bank and GazaWorldYemen, Rep.ZambiaZimbabwe La ligne de temps
Cette échelle de temps montre un graphique de 1973 année à 2014 année Zambia. Les données jusqu'à 1972 année ne sont pas présentés. Quantité d'observations actuelles selon dates: 30.
Source (désignation):
Les indicateurs du développement mondiale
Source (organisation):
UNESCO Institute for Statistics
Catégories:
Education, Gender
Dernière mise à jour
23 avr. 2017
Les indicateurs de changement de valeurs selon les années
Minimum:
1.002
1 janv. 1979
Maximum:
7.069
1 janv. 2003
Pour la date d''observation
Valeur
Changement absolu
Le changement par rapport à la valeur précédente
1 janv. 1973
1.698
+1.698
0.0%
1 janv. 1974
1.623
-0.075
-4.43%
1 janv. 1975
1.732
+0.109
6.74%
1 janv. 1976
1.755
+0.022
1.28%
1 janv. 1977
1.463
-0.291
-16.59%
1 janv. 1978
1.117
-0.346
-23.65%
1 janv. 1979
1.002
-0.116
-10.35%
1 janv. 1980
1.39
+0.389
38.8%
1 janv. 1981
1.6
+0.209
15.06%
1 janv. 1982
1.274
-0.326
-20.37%
1 janv. 1983
1.1
-0.174
-13.69%
1 janv. 1984
1.303
+0.203
18.5%
1 janv. 1985
1.559
+0.256
19.63%
1 janv. 1987
1.887
+0.328
21.07%
1 janv. 1995
2.237
+0.35
18.53%
1 janv. 1996
2.563
+0.326
14.58%
1 janv. 1999
6.17
+3.607
140.73%
1 janv. 2000
5.792
-0.378
-6.13%
1 janv. 2001
5.86
+0.068
1.18%
1 janv. 2003
7.069
+1.208
20.62%
1 janv. 2005
6.81
-0.258
-3.65%
1 janv. 2006
6.014
-0.796
-11.7%
1 janv. 2007
6.477
+0.463
7.71%
1 janv. 2008
6.155
-0.322
-4.97%
1 janv. 2009
5.655
-0.5
-8.12%
1 janv. 2010
5.892
+0.237
4.19%
1 janv. 2011
5.67
-0.223
-3.78%
1 janv. 2012
5.652
-0.017
-0.3%
1 janv. 2013
5.133
-0.519
-9.18%
1 janv. 2014
5.351
+0.217
4.23%
Classement des pays selon les statistiques actuelles par années


Commentaires: