29
/fr/
fr
AIzaSyAYiBZKx7MnpbEhh9jyipgxe19OcubqV5w
April 1, 2024
38973
IDA only
IDX
false
2
1
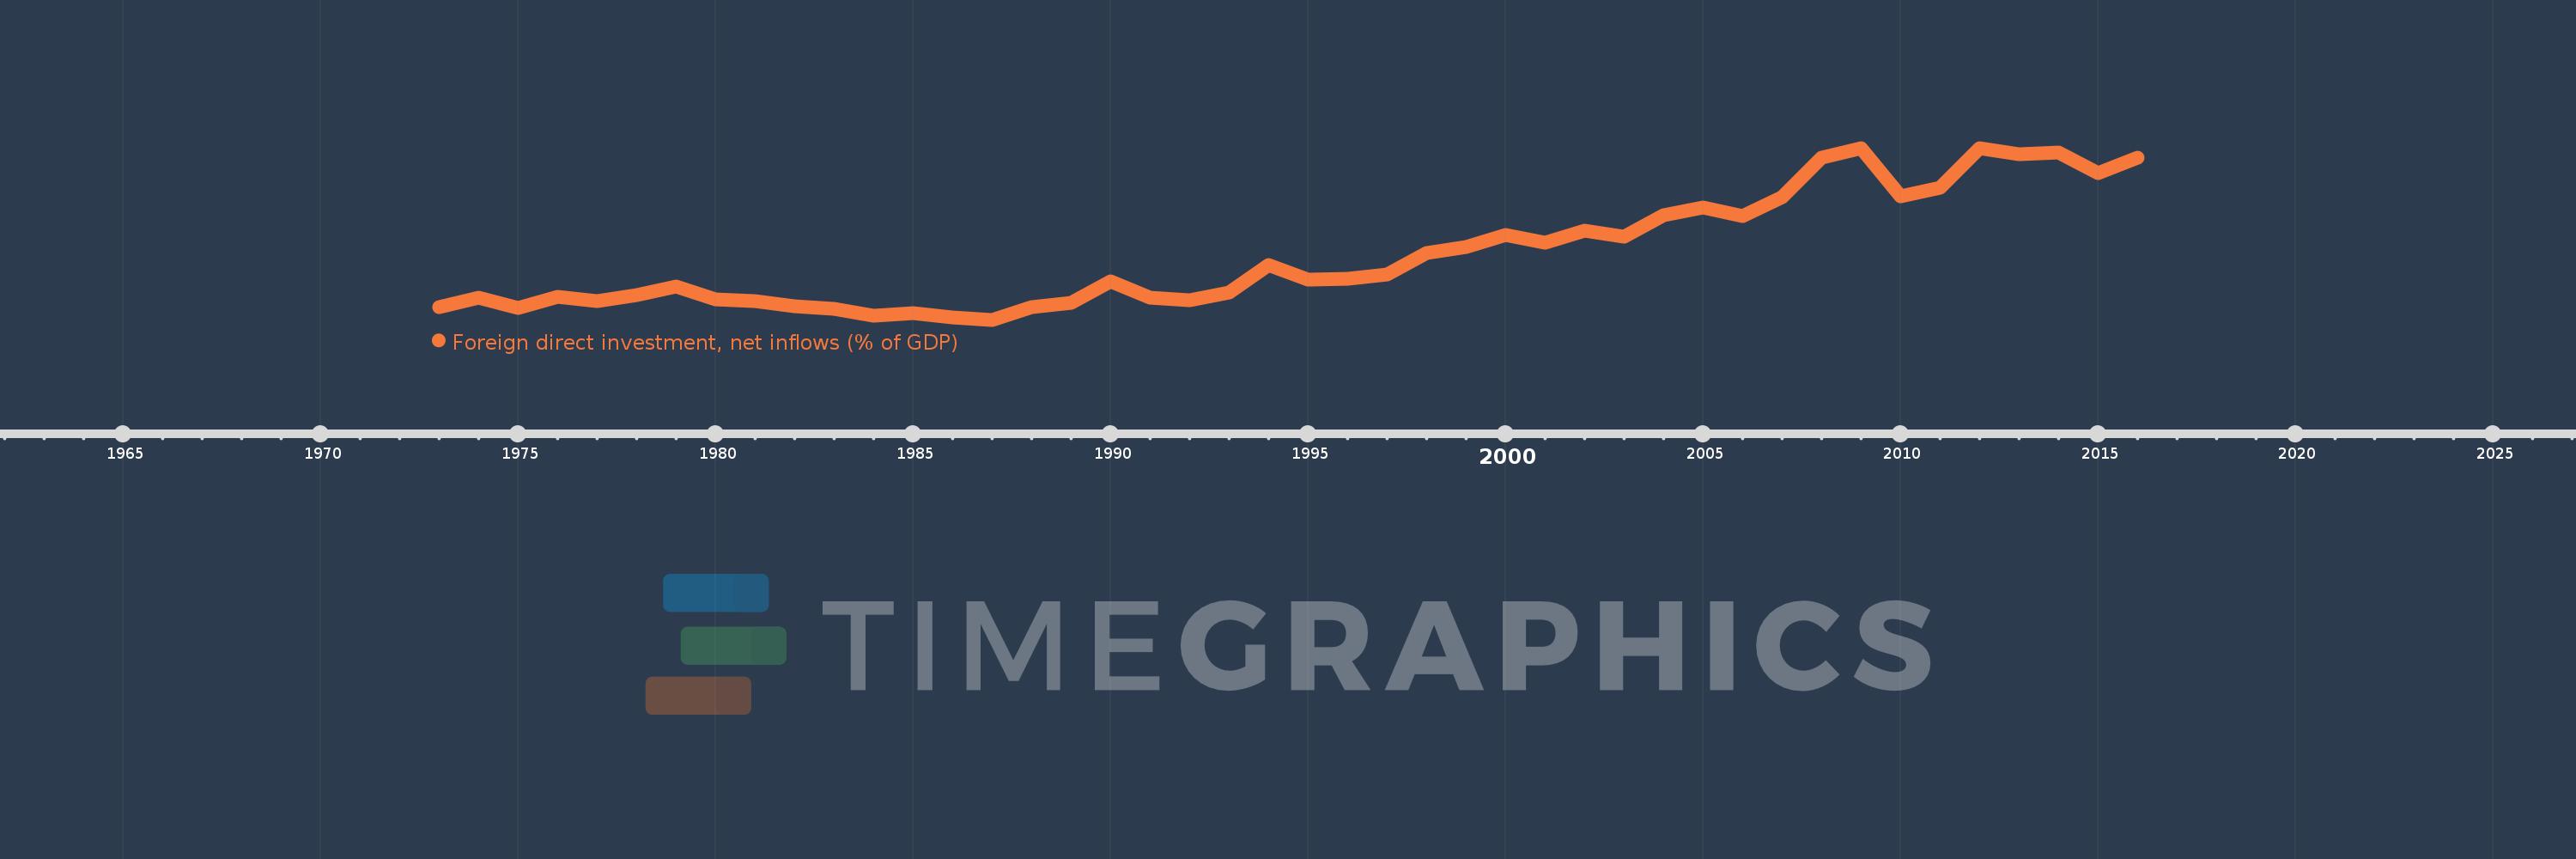
Foreign direct investment, net inflows (% of GDP)
2016,2015,2014,2013,2012,2011,2010,2009,2008,2007,2006,2005,2004,2003,2002,2001,2000,1999,1998,1997,1996,1995,1994,1993,1992,1991,1990,1989,1988,1987,1986,1985,1984,1983,1982,1981,1980,1979,1978,1977,1976,1975,1974,1973
Cette statistique dans les autres pays:
AfghanistanAlbaniaAlgeriaAngolaAntigua and BarbudaArab WorldArgentinaArmeniaArubaAustraliaAustriaAzerbaijanBahamas, TheBahrainBangladeshBarbadosBelarusBelgiumBelizeBeninBermudaBhutanBoliviaBosnia and HerzegovinaBotswanaBrazilBrunei DarussalamBulgariaBurkina FasoBurundiCabo VerdeCambodiaCameroonCanadaCaribbean small statesCayman IslandsCentral African RepublicCentral Europe and the BalticsChadChileChinaColombiaComorosCongo, Dem. Rep.Congo, Rep.Costa RicaCote d'IvoireCroatiaCyprusCzech RepublicDenmarkDjiboutiDominicaDominican RepublicEarly-demographic dividendEast Asia & PacificEast Asia & Pacific (excluding high income)East Asia & Pacific (IDA & IBRD countries)EcuadorEgypt, Arab Rep.El SalvadorEquatorial GuineaEritreaEstoniaEthiopiaEuro areaEurope & Central AsiaEurope & Central Asia (excluding high income)Europe & Central Asia (IDA & IBRD countries)European UnionFijiFinlandFragile and conflict affected situationsFranceFrench PolynesiaGabonGambia, TheGeorgiaGermanyGhanaGreeceGrenadaGuatemalaGuineaGuinea-BissauGuyanaHaitiHeavily indebted poor countries (HIPC)High incomeHondurasHong Kong SAR, ChinaHungaryIBRD onlyIcelandIDA & IBRD totalIDA blendIDA onlyIDA totalIndiaIndonesiaIran, Islamic Rep.IraqIrelandIsraelItalyJamaicaJapanJordanKazakhstanKenyaKiribatiKorea, Rep.KosovoKuwaitKyrgyz RepublicLao PDRLate-demographic dividendLatin America & Caribbean Latin America & Caribbean (excluding high income)Latin America & the Caribbean (IDA & IBRD countries)LatviaLeast developed countries: UN classificationLebanonLesothoLiberiaLibyaLithuaniaLow & middle incomeLow incomeLower middle incomeLuxembourgMacao SAR, ChinaMacedonia, FYRMadagascarMalawiMalaysiaMaldivesMaliMaltaMarshall IslandsMauritaniaMauritiusMexicoMicronesia, Fed. Sts.Middle East & North AfricaMiddle East & North Africa (excluding high income)Middle East & North Africa (IDA & IBRD countries)Middle incomeMoldovaMongoliaMontenegroMoroccoMozambiqueMyanmarNamibiaNauruNepalNetherlandsNew CaledoniaNew ZealandNicaraguaNigerNigeriaNorth AmericaNorwayOECD membersOmanOther small statesPacific island small statesPakistanPalauPanamaPapua New GuineaParaguayPeruPhilippinesPolandPortugalPost-demographic dividendPre-demographic dividendQatarRomaniaRussian FederationRwandaSamoaSao Tome and PrincipeSaudi ArabiaSenegalSerbiaSeychellesSierra LeoneSingaporeSlovak RepublicSloveniaSmall statesSolomon IslandsSomaliaSouth AfricaSouth AsiaSouth Asia (IDA & IBRD)South SudanSpainSri LankaSt. Kitts and NevisSt. LuciaSt. Vincent and the GrenadinesSub-Saharan Africa Sub-Saharan Africa (excluding high income)Sub-Saharan Africa (IDA & IBRD countries)SudanSurinameSwazilandSwedenSwitzerlandSyrian Arab RepublicTajikistanTanzaniaThailandTimor-LesteTogoTongaTrinidad and TobagoTunisiaTurkeyTurkmenistanTuvaluUgandaUkraineUnited Arab EmiratesUnited KingdomUnited StatesUpper middle incomeUruguayUzbekistanVanuatuVenezuela, RBVietnamWest Bank and GazaWorldYemen, Rep.ZambiaZimbabwe La ligne de temps
Cette échelle de temps montre un graphique de 1973 année à 2016 année IDA only. Les données jusqu'à 1972 année ne sont pas présentés. Quantité d'observations actuelles selon dates: 44.
Source (désignation):
Les indicateurs du développement mondiale
Source (organisation):
International Monetary Fund, International Financial Statistics and Balance of Payments databases, World Bank, International Debt Statistics, and World Bank and OECD GDP estimates.
Catégories:
Economy & Growth, Financial Sector, Climate Change
Dernière mise à jour
23 avr. 2017
Les indicateurs de changement de valeurs selon les années
Minimum:
0.102
1 janv. 1987
Maximum:
3.924
1 janv. 2012
Pour la date d''observation
Valeur
Changement absolu
Le changement par rapport à la valeur précédente
1 janv. 1973
0.384
+0.384
0.0%
1 janv. 1974
0.596
+0.212
55.27%
1 janv. 1975
0.367
-0.229
-38.47%
1 janv. 1976
0.618
+0.251
68.33%
1 janv. 1977
0.516
-0.102
-16.54%
1 janv. 1978
0.65
+0.134
26.01%
1 janv. 1979
0.845
+0.195
30.01%
1 janv. 1980
0.551
-0.294
-34.77%
1 janv. 1981
0.519
-0.032
-5.85%
1 janv. 1982
0.411
-0.108
-20.76%
1 janv. 1983
0.339
-0.072
-17.51%
1 janv. 1984
0.188
-0.151
-44.67%
1 janv. 1985
0.254
+0.066
35.17%
1 janv. 1986
0.158
-0.095
-37.6%
1 janv. 1987
0.102
-0.057
-35.75%
1 janv. 1988
0.39
+0.289
283.91%
1 janv. 1989
0.479
+0.089
22.74%
1 janv. 1990
0.948
+0.469
98.02%
1 janv. 1991
0.593
-0.355
-37.47%
1 janv. 1992
0.538
-0.055
-9.2%
1 janv. 1993
0.702
+0.163
30.3%
1 janv. 1994
1.328
+0.626
89.25%
1 janv. 1995
0.999
-0.329
-24.76%
1 janv. 1996
1.009
+0.01
0.95%
1 janv. 1997
1.116
+0.107
10.63%
1 janv. 1998
1.595
+0.479
42.9%
1 janv. 1999
1.73
+0.135
8.5%
1 janv. 2000
1.986
+0.256
14.81%
1 janv. 2001
1.813
-0.173
-8.73%
1 janv. 2002
2.088
+0.275
15.18%
1 janv. 2003
1.945
-0.143
-6.87%
1 janv. 2004
2.429
+0.484
24.9%
1 janv. 2005
2.6
+0.171
7.06%
1 janv. 2006
2.403
-0.197
-7.58%
1 janv. 2007
2.835
+0.432
17.96%
1 janv. 2008
3.713
+0.878
30.97%
1 janv. 2009
3.919
+0.206
5.56%
1 janv. 2010
2.854
-1.065
-27.16%
1 janv. 2011
3.039
+0.185
6.48%
1 janv. 2012
3.924
+0.884
29.09%
1 janv. 2013
3.788
-0.136
-3.47%
1 janv. 2014
3.815
+0.028
0.74%
1 janv. 2015
3.366
-0.449
-11.77%
1 janv. 2016
3.711
+0.345
10.24%
Classement des pays selon les statistiques actuelles par années


Commentaires: