29
/fr/
fr
AIzaSyAYiBZKx7MnpbEhh9jyipgxe19OcubqV5w
April 1, 2024
201552
Morocco
MAR
true
2
1
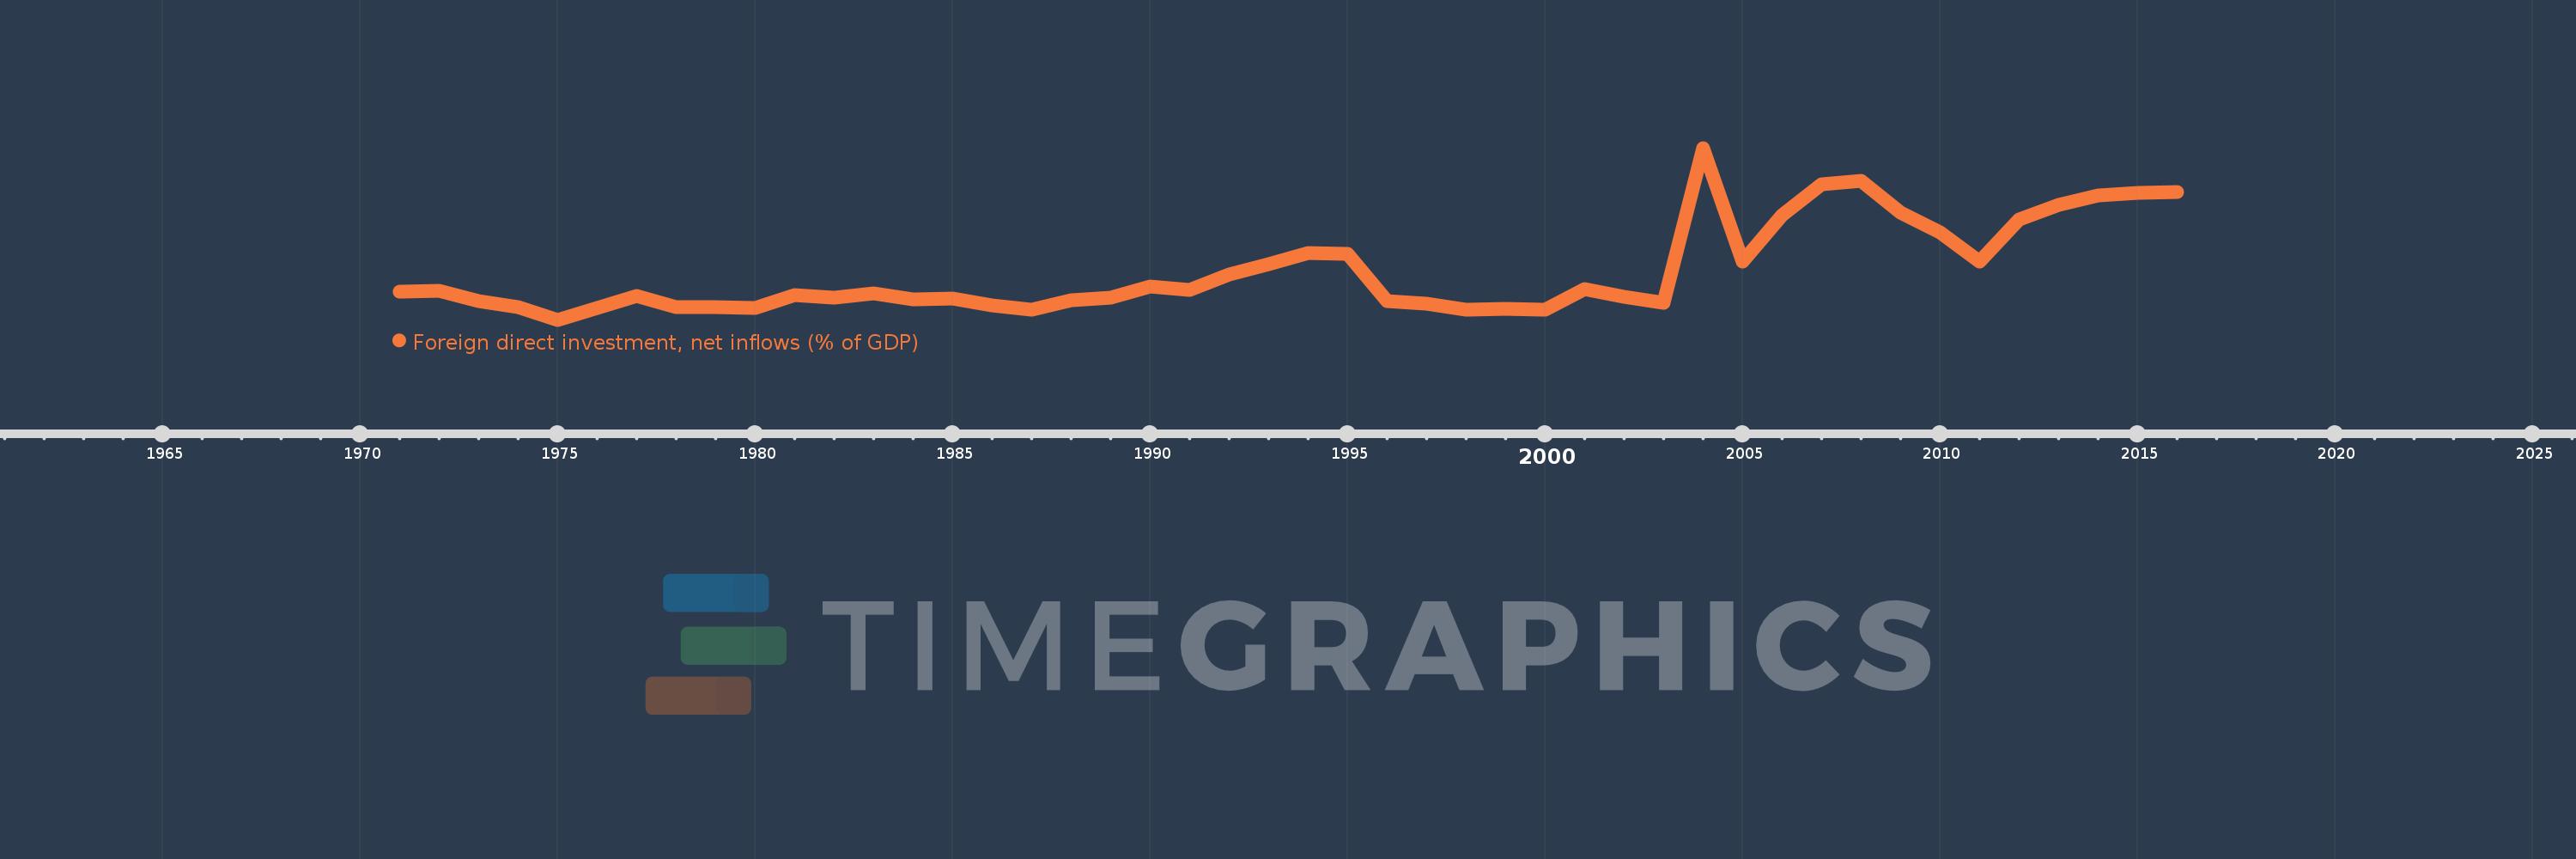
Foreign direct investment, net inflows (% of GDP)
2016,2015,2014,2013,2012,2011,2010,2009,2008,2007,2006,2005,2004,2003,2002,2001,2000,1999,1998,1997,1996,1995,1994,1993,1992,1991,1990,1989,1988,1987,1986,1985,1984,1983,1982,1981,1980,1979,1978,1977,1976,1975,1974,1973,1972,1971
Cette statistique dans les autres pays:
AfghanistanAlbaniaAlgeriaAngolaAntigua and BarbudaArab WorldArgentinaArmeniaArubaAustraliaAustriaAzerbaijanBahamas, TheBahrainBangladeshBarbadosBelarusBelgiumBelizeBeninBermudaBhutanBoliviaBosnia and HerzegovinaBotswanaBrazilBrunei DarussalamBulgariaBurkina FasoBurundiCabo VerdeCambodiaCameroonCanadaCaribbean small statesCayman IslandsCentral African RepublicCentral Europe and the BalticsChadChileChinaColombiaComorosCongo, Dem. Rep.Congo, Rep.Costa RicaCote d'IvoireCroatiaCyprusCzech RepublicDenmarkDjiboutiDominicaDominican RepublicEarly-demographic dividendEast Asia & PacificEast Asia & Pacific (excluding high income)East Asia & Pacific (IDA & IBRD countries)EcuadorEgypt, Arab Rep.El SalvadorEquatorial GuineaEritreaEstoniaEthiopiaEuro areaEurope & Central AsiaEurope & Central Asia (excluding high income)Europe & Central Asia (IDA & IBRD countries)European UnionFijiFinlandFragile and conflict affected situationsFranceFrench PolynesiaGabonGambia, TheGeorgiaGermanyGhanaGreeceGrenadaGuatemalaGuineaGuinea-BissauGuyanaHaitiHeavily indebted poor countries (HIPC)High incomeHondurasHong Kong SAR, ChinaHungaryIBRD onlyIcelandIDA & IBRD totalIDA blendIDA onlyIDA totalIndiaIndonesiaIran, Islamic Rep.IraqIrelandIsraelItalyJamaicaJapanJordanKazakhstanKenyaKiribatiKorea, Rep.KosovoKuwaitKyrgyz RepublicLao PDRLate-demographic dividendLatin America & Caribbean Latin America & Caribbean (excluding high income)Latin America & the Caribbean (IDA & IBRD countries)LatviaLeast developed countries: UN classificationLebanonLesothoLiberiaLibyaLithuaniaLow & middle incomeLow incomeLower middle incomeLuxembourgMacao SAR, ChinaMacedonia, FYRMadagascarMalawiMalaysiaMaldivesMaliMaltaMarshall IslandsMauritaniaMauritiusMexicoMicronesia, Fed. Sts.Middle East & North AfricaMiddle East & North Africa (excluding high income)Middle East & North Africa (IDA & IBRD countries)Middle incomeMoldovaMongoliaMontenegroMoroccoMozambiqueMyanmarNamibiaNauruNepalNetherlandsNew CaledoniaNew ZealandNicaraguaNigerNigeriaNorth AmericaNorwayOECD membersOmanOther small statesPacific island small statesPakistanPalauPanamaPapua New GuineaParaguayPeruPhilippinesPolandPortugalPost-demographic dividendPre-demographic dividendQatarRomaniaRussian FederationRwandaSamoaSao Tome and PrincipeSaudi ArabiaSenegalSerbiaSeychellesSierra LeoneSingaporeSlovak RepublicSloveniaSmall statesSolomon IslandsSomaliaSouth AfricaSouth AsiaSouth Asia (IDA & IBRD)South SudanSpainSri LankaSt. Kitts and NevisSt. LuciaSt. Vincent and the GrenadinesSub-Saharan Africa Sub-Saharan Africa (excluding high income)Sub-Saharan Africa (IDA & IBRD countries)SudanSurinameSwazilandSwedenSwitzerlandSyrian Arab RepublicTajikistanTanzaniaThailandTimor-LesteTogoTongaTrinidad and TobagoTunisiaTurkeyTurkmenistanTuvaluUgandaUkraineUnited Arab EmiratesUnited KingdomUnited StatesUpper middle incomeUruguayUzbekistanVanuatuVenezuela, RBVietnamWest Bank and GazaWorldYemen, Rep.ZambiaZimbabwe La ligne de temps
Cette échelle de temps montre un graphique de 1971 année à 2016 année Morocco. Les données jusqu'à 1970 année ne sont pas présentés. Quantité d'observations actuelles selon dates: 46.
Source (désignation):
Les indicateurs du développement mondiale
Source (organisation):
International Monetary Fund, International Financial Statistics and Balance of Payments databases, World Bank, International Debt Statistics, and World Bank and OECD GDP estimates.
Catégories:
Economy & Growth, Financial Sector, Climate Change
Dernière mise à jour
23 avr. 2017
Les indicateurs de changement de valeurs selon les années
Minimum:
-0.266
1 janv. 1975
Maximum:
4.442
1 janv. 2004
Pour la date d''observation
Valeur
Changement absolu
Le changement par rapport à la valeur précédente
1 janv. 1971
0.506
+0.506
0.0%
1 janv. 1972
0.53
+0.025
4.89%
1 janv. 1973
0.256
-0.274
-51.68%
1 janv. 1974
0.088
-0.168
-65.67%
1 janv. 1975
-0.266
-0.354
-402.2%
1 janv. 1976
0.056
+0.322
-121.02%
1 janv. 1977
0.397
+0.341
609.9%
1 janv. 1978
0.072
-0.324
-81.76%
1 janv. 1979
0.089
+0.016
22.8%
1 janv. 1980
0.047
-0.042
-47.39%
1 janv. 1981
0.412
+0.365
780.4%
1 janv. 1982
0.329
-0.082
-19.97%
1 janv. 1983
0.45
+0.12
36.49%
1 janv. 1984
0.284
-0.166
-36.86%
1 janv. 1985
0.317
+0.033
11.68%
1 janv. 1986
0.133
-0.184
-57.96%
1 janv. 1987
0.003
-0.13
-97.88%
1 janv. 1988
0.274
+0.271
9.6 milles%
1 janv. 1989
0.329
+0.056
20.33%
1 janv. 1990
0.635
+0.305
92.76%
1 janv. 1991
0.547
-0.088
-13.82%
1 janv. 1992
0.983
+0.436
79.72%
1 janv. 1993
1.253
+0.27
27.45%
1 janv. 1994
1.553
+0.299
23.89%
1 janv. 1995
1.547
-0.005
-0.33%
1 janv. 1996
0.237
-1.311
-84.7%
1 janv. 1997
0.177
-0.06
-25.21%
1 janv. 1998
0.009
-0.168
-94.85%
1 janv. 1999
0.028
+0.019
211.45%
1 janv. 2000
0.006
-0.022
-77.56%
1 janv. 2001
0.568
+0.562
8.82 milles%
1 janv. 2002
0.365
-0.204
-35.83%
1 janv. 2003
0.187
-0.177
-48.58%
1 janv. 2004
4.442
+4.255
2.27 milles%
1 janv. 2005
1.32
-3.122
-70.28%
1 janv. 2006
2.598
+1.278
96.83%
1 janv. 2007
3.447
+0.849
32.67%
1 janv. 2008
3.551
+0.104
3.01%
1 janv. 2009
2.666
-0.885
-24.92%
1 janv. 2010
2.121
-0.545
-20.45%
1 janv. 2011
1.331
-0.79
-37.25%
1 janv. 2012
2.487
+1.156
86.89%
1 janv. 2013
2.892
+0.405
16.28%
1 janv. 2014
3.146
+0.254
8.78%
1 janv. 2015
3.209
+0.062
1.98%
1 janv. 2016
3.234
+0.025
0.78%
Classement des pays selon les statistiques actuelles par années


Commentaires: