29
/fr/
fr
AIzaSyAYiBZKx7MnpbEhh9jyipgxe19OcubqV5w
April 1, 2024
153521
Iceland
ISL
true
2
1
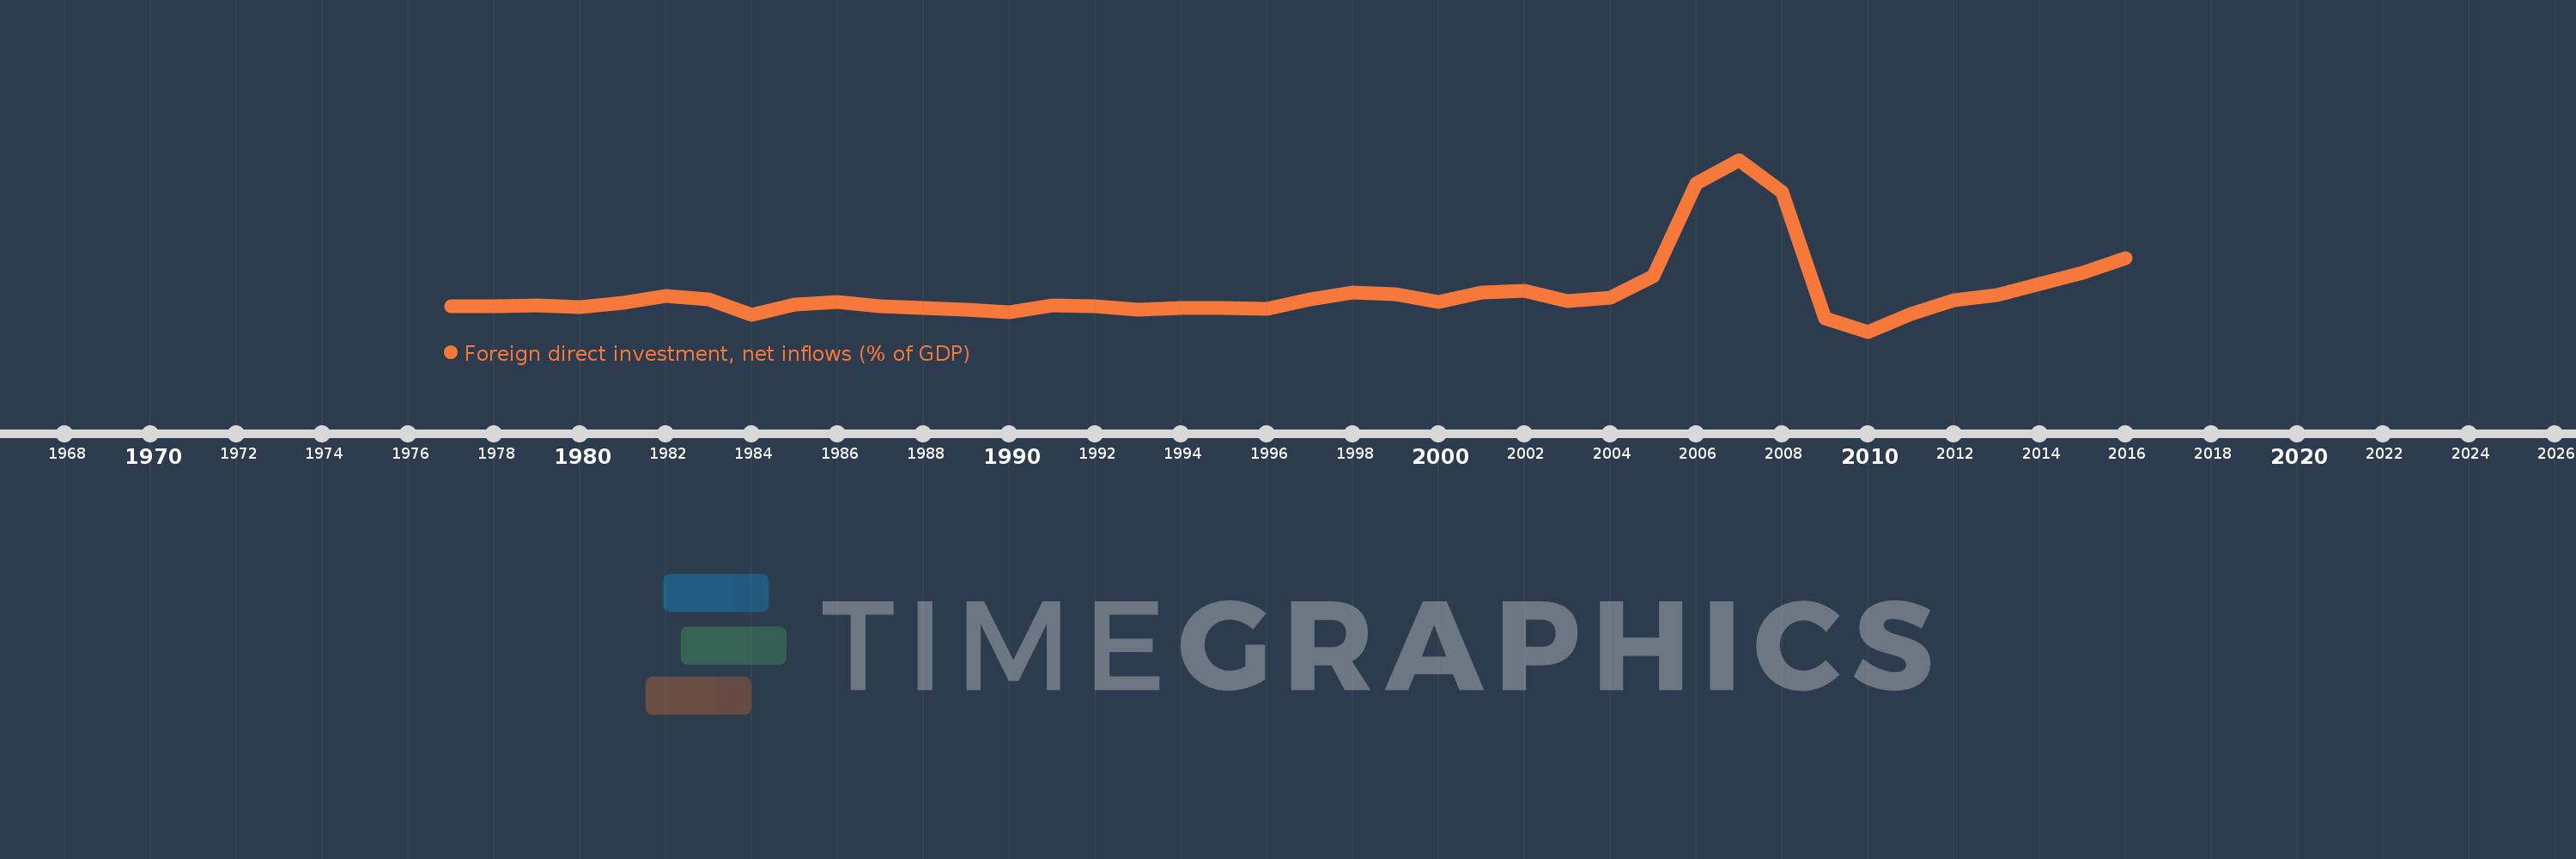
Foreign direct investment, net inflows (% of GDP)
2016,2015,2014,2013,2012,2011,2010,2009,2008,2007,2006,2005,2004,2003,2002,2001,2000,1999,1998,1997,1996,1995,1994,1993,1992,1991,1990,1989,1988,1987,1986,1985,1984,1983,1982,1981,1980,1979,1978,1977
Cette statistique dans les autres pays:
AfghanistanAlbaniaAlgeriaAngolaAntigua and BarbudaArab WorldArgentinaArmeniaArubaAustraliaAustriaAzerbaijanBahamas, TheBahrainBangladeshBarbadosBelarusBelgiumBelizeBeninBermudaBhutanBoliviaBosnia and HerzegovinaBotswanaBrazilBrunei DarussalamBulgariaBurkina FasoBurundiCabo VerdeCambodiaCameroonCanadaCaribbean small statesCayman IslandsCentral African RepublicCentral Europe and the BalticsChadChileChinaColombiaComorosCongo, Dem. Rep.Congo, Rep.Costa RicaCote d'IvoireCroatiaCyprusCzech RepublicDenmarkDjiboutiDominicaDominican RepublicEarly-demographic dividendEast Asia & PacificEast Asia & Pacific (excluding high income)East Asia & Pacific (IDA & IBRD countries)EcuadorEgypt, Arab Rep.El SalvadorEquatorial GuineaEritreaEstoniaEthiopiaEuro areaEurope & Central AsiaEurope & Central Asia (excluding high income)Europe & Central Asia (IDA & IBRD countries)European UnionFijiFinlandFragile and conflict affected situationsFranceFrench PolynesiaGabonGambia, TheGeorgiaGermanyGhanaGreeceGrenadaGuatemalaGuineaGuinea-BissauGuyanaHaitiHeavily indebted poor countries (HIPC)High incomeHondurasHong Kong SAR, ChinaHungaryIBRD onlyIcelandIDA & IBRD totalIDA blendIDA onlyIDA totalIndiaIndonesiaIran, Islamic Rep.IraqIrelandIsraelItalyJamaicaJapanJordanKazakhstanKenyaKiribatiKorea, Rep.KosovoKuwaitKyrgyz RepublicLao PDRLate-demographic dividendLatin America & Caribbean Latin America & Caribbean (excluding high income)Latin America & the Caribbean (IDA & IBRD countries)LatviaLeast developed countries: UN classificationLebanonLesothoLiberiaLibyaLithuaniaLow & middle incomeLow incomeLower middle incomeLuxembourgMacao SAR, ChinaMacedonia, FYRMadagascarMalawiMalaysiaMaldivesMaliMaltaMarshall IslandsMauritaniaMauritiusMexicoMicronesia, Fed. Sts.Middle East & North AfricaMiddle East & North Africa (excluding high income)Middle East & North Africa (IDA & IBRD countries)Middle incomeMoldovaMongoliaMontenegroMoroccoMozambiqueMyanmarNamibiaNauruNepalNetherlandsNew CaledoniaNew ZealandNicaraguaNigerNigeriaNorth AmericaNorwayOECD membersOmanOther small statesPacific island small statesPakistanPalauPanamaPapua New GuineaParaguayPeruPhilippinesPolandPortugalPost-demographic dividendPre-demographic dividendQatarRomaniaRussian FederationRwandaSamoaSao Tome and PrincipeSaudi ArabiaSenegalSerbiaSeychellesSierra LeoneSingaporeSlovak RepublicSloveniaSmall statesSolomon IslandsSomaliaSouth AfricaSouth AsiaSouth Asia (IDA & IBRD)South SudanSpainSri LankaSt. Kitts and NevisSt. LuciaSt. Vincent and the GrenadinesSub-Saharan Africa Sub-Saharan Africa (excluding high income)Sub-Saharan Africa (IDA & IBRD countries)SudanSurinameSwazilandSwedenSwitzerlandSyrian Arab RepublicTajikistanTanzaniaThailandTimor-LesteTogoTongaTrinidad and TobagoTunisiaTurkeyTurkmenistanTuvaluUgandaUkraineUnited Arab EmiratesUnited KingdomUnited StatesUpper middle incomeUruguayUzbekistanVanuatuVenezuela, RBVietnamWest Bank and GazaWorldYemen, Rep.ZambiaZimbabwe La ligne de temps
Cette échelle de temps montre un graphique de 1977 année à 2016 année Iceland. Les données jusqu'à 1976 année ne sont pas présentés. Quantité d'observations actuelles selon dates: 40.
Source (désignation):
Les indicateurs du développement mondiale
Source (organisation):
International Monetary Fund, International Financial Statistics and Balance of Payments databases, World Bank, International Debt Statistics, and World Bank and OECD GDP estimates.
Catégories:
Economy & Growth, Financial Sector, Climate Change
Dernière mise à jour
23 avr. 2017
Les indicateurs de changement de valeurs selon les années
Minimum:
-2.973
1 janv. 2010
Maximum:
18.719
1 janv. 2007
Pour la date d''observation
Valeur
Changement absolu
Le changement par rapport à la valeur précédente
1 janv. 1977
0.267
+0.267
0.0%
1 janv. 1978
0.189
-0.079
-29.45%
1 janv. 1979
0.32
+0.131
69.57%
1 janv. 1980
0.108
-0.212
-66.31%
1 janv. 1981
0.654
+0.546
507.03%
1 janv. 1982
1.505
+0.851
130.08%
1 janv. 1983
1.107
-0.398
-26.42%
1 janv. 1984
-0.839
-1.947
-175.78%
1 janv. 1985
0.474
+1.314
-156.53%
1 janv. 1986
0.784
+0.31
65.36%
1 janv. 1987
0.211
-0.573
-73.06%
1 janv. 1988
0.043
-0.168
-79.59%
1 janv. 1989
-0.24
-0.284
-657.46%
1 janv. 1990
-0.479
-0.239
99.3%
1 janv. 1991
0.34
+0.819
-170.87%
1 janv. 1992
0.265
-0.075
-21.94%
1 janv. 1993
-0.183
-0.448
-168.87%
1 janv. 1994
0.003
+0.186
-101.84%
1 janv. 1995
-0.021
-0.025
-732.86%
1 janv. 1996
-0.13
-0.108
508.43%
1 janv. 1997
1.111
+1.241
-957.02%
1 janv. 1998
1.946
+0.835
75.12%
1 janv. 1999
1.768
-0.178
-9.13%
1 janv. 2000
0.733
-1.036
-58.58%
1 janv. 2001
1.952
+1.22
166.48%
1 janv. 2002
2.227
+0.275
14.1%
1 janv. 2003
0.841
-1.386
-62.23%
1 janv. 2004
1.363
+0.522
62.02%
1 janv. 2005
4.061
+2.698
197.94%
1 janv. 2006
15.768
+11.707
288.27%
1 janv. 2007
18.719
+2.951
18.71%
1 janv. 2008
14.697
-4.023
-21.49%
1 janv. 2009
-1.26
-15.956
-108.57%
1 janv. 2010
-2.973
-1.713
135.99%
1 janv. 2011
-0.704
+2.269
-76.33%
1 janv. 2012
0.935
+1.639
-232.9%
1 janv. 2013
1.682
+0.747
79.88%
1 janv. 2014
3.074
+1.392
82.74%
1 janv. 2015
4.501
+1.427
46.44%
1 janv. 2016
6.261
+1.76
39.1%
Classement des pays selon les statistiques actuelles par années


Commentaires: