29
/fr/
fr
AIzaSyAYiBZKx7MnpbEhh9jyipgxe19OcubqV5w
April 1, 2024
141789
Greece
GRC
true
2
1
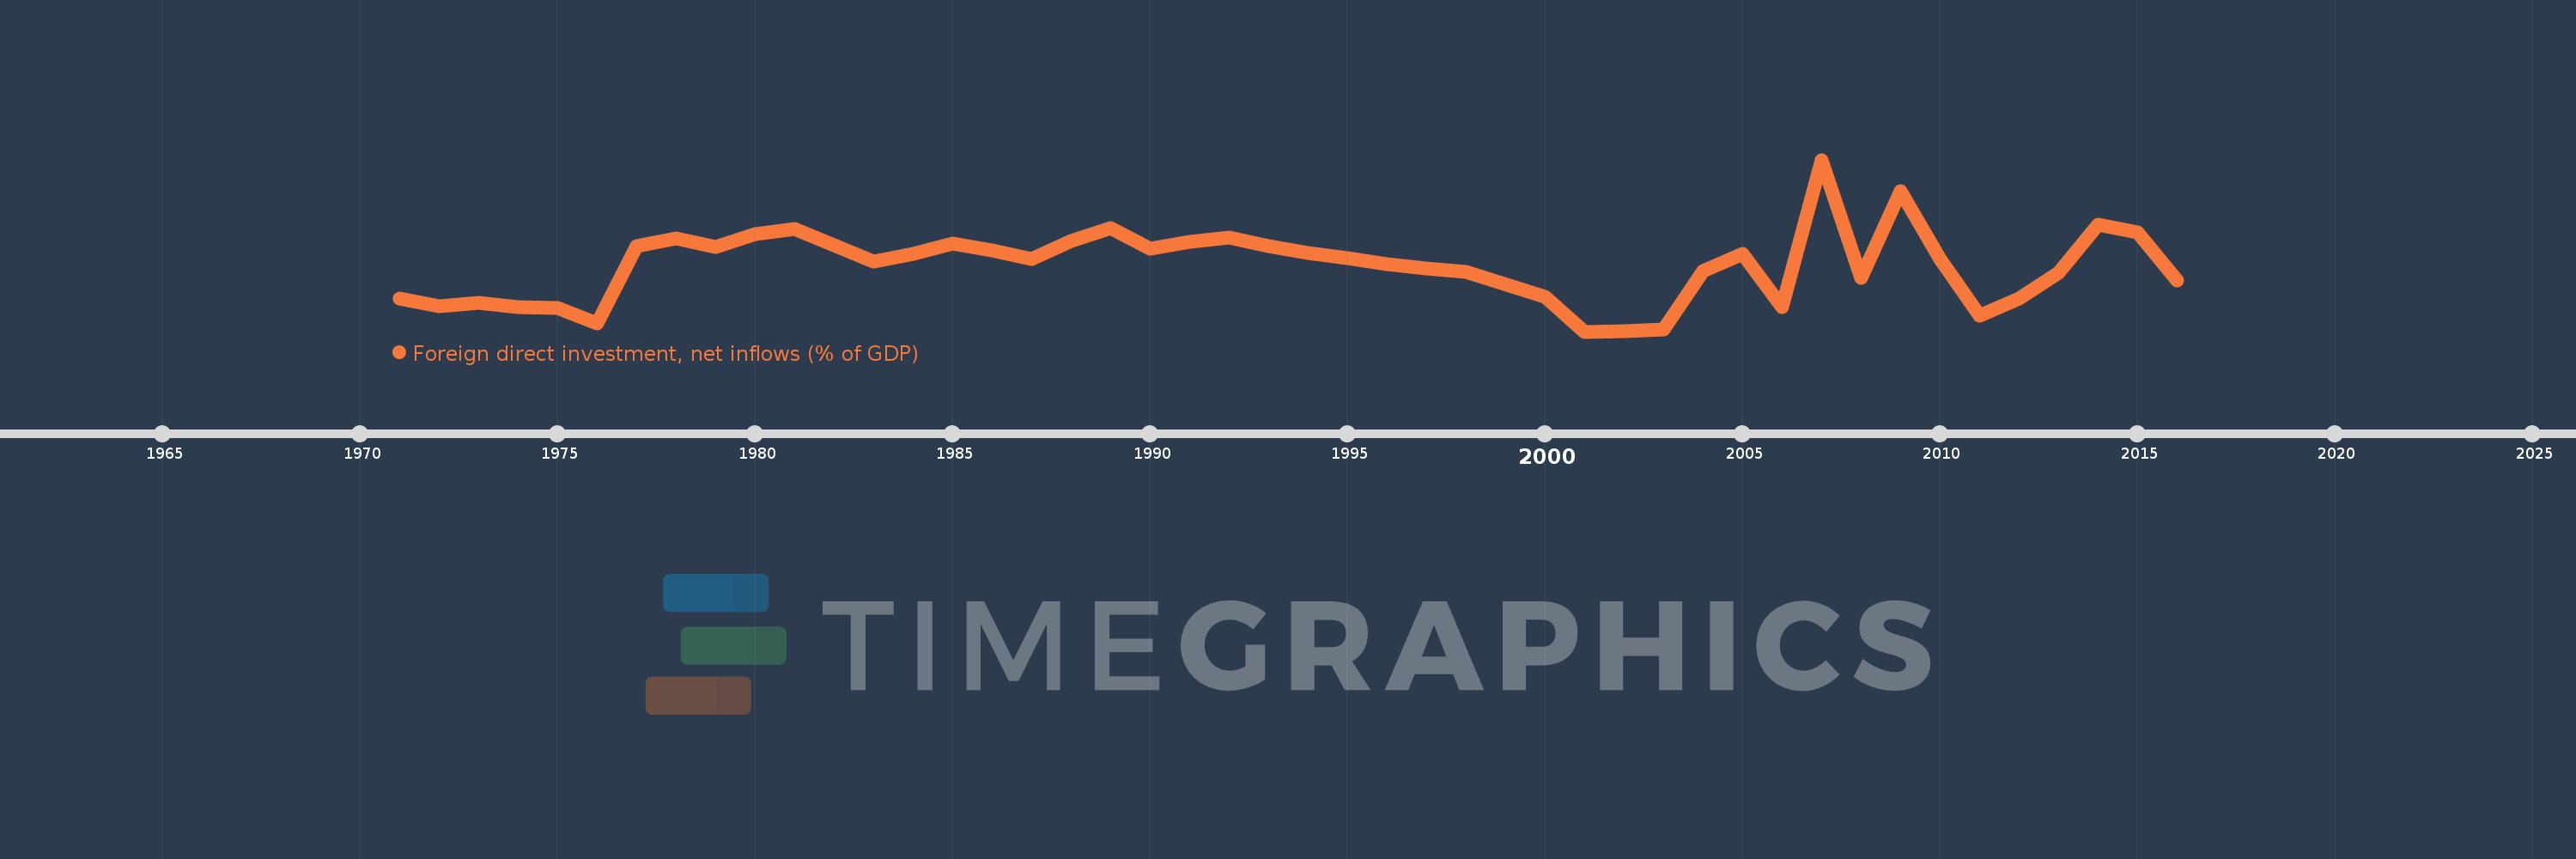
Foreign direct investment, net inflows (% of GDP)
2016,2015,2014,2013,2012,2011,2010,2009,2008,2007,2006,2005,2004,2003,2002,2001,2000,1998,1997,1996,1995,1994,1993,1992,1991,1990,1989,1988,1987,1986,1985,1984,1983,1982,1981,1980,1979,1978,1977,1976,1975,1974,1973,1972,1971
Cette statistique dans les autres pays:
AfghanistanAlbaniaAlgeriaAngolaAntigua and BarbudaArab WorldArgentinaArmeniaArubaAustraliaAustriaAzerbaijanBahamas, TheBahrainBangladeshBarbadosBelarusBelgiumBelizeBeninBermudaBhutanBoliviaBosnia and HerzegovinaBotswanaBrazilBrunei DarussalamBulgariaBurkina FasoBurundiCabo VerdeCambodiaCameroonCanadaCaribbean small statesCayman IslandsCentral African RepublicCentral Europe and the BalticsChadChileChinaColombiaComorosCongo, Dem. Rep.Congo, Rep.Costa RicaCote d'IvoireCroatiaCyprusCzech RepublicDenmarkDjiboutiDominicaDominican RepublicEarly-demographic dividendEast Asia & PacificEast Asia & Pacific (excluding high income)East Asia & Pacific (IDA & IBRD countries)EcuadorEgypt, Arab Rep.El SalvadorEquatorial GuineaEritreaEstoniaEthiopiaEuro areaEurope & Central AsiaEurope & Central Asia (excluding high income)Europe & Central Asia (IDA & IBRD countries)European UnionFijiFinlandFragile and conflict affected situationsFranceFrench PolynesiaGabonGambia, TheGeorgiaGermanyGhanaGreeceGrenadaGuatemalaGuineaGuinea-BissauGuyanaHaitiHeavily indebted poor countries (HIPC)High incomeHondurasHong Kong SAR, ChinaHungaryIBRD onlyIcelandIDA & IBRD totalIDA blendIDA onlyIDA totalIndiaIndonesiaIran, Islamic Rep.IraqIrelandIsraelItalyJamaicaJapanJordanKazakhstanKenyaKiribatiKorea, Rep.KosovoKuwaitKyrgyz RepublicLao PDRLate-demographic dividendLatin America & Caribbean Latin America & Caribbean (excluding high income)Latin America & the Caribbean (IDA & IBRD countries)LatviaLeast developed countries: UN classificationLebanonLesothoLiberiaLibyaLithuaniaLow & middle incomeLow incomeLower middle incomeLuxembourgMacao SAR, ChinaMacedonia, FYRMadagascarMalawiMalaysiaMaldivesMaliMaltaMarshall IslandsMauritaniaMauritiusMexicoMicronesia, Fed. Sts.Middle East & North AfricaMiddle East & North Africa (excluding high income)Middle East & North Africa (IDA & IBRD countries)Middle incomeMoldovaMongoliaMontenegroMoroccoMozambiqueMyanmarNamibiaNauruNepalNetherlandsNew CaledoniaNew ZealandNicaraguaNigerNigeriaNorth AmericaNorwayOECD membersOmanOther small statesPacific island small statesPakistanPalauPanamaPapua New GuineaParaguayPeruPhilippinesPolandPortugalPost-demographic dividendPre-demographic dividendQatarRomaniaRussian FederationRwandaSamoaSao Tome and PrincipeSaudi ArabiaSenegalSerbiaSeychellesSierra LeoneSingaporeSlovak RepublicSloveniaSmall statesSolomon IslandsSomaliaSouth AfricaSouth AsiaSouth Asia (IDA & IBRD)South SudanSpainSri LankaSt. Kitts and NevisSt. LuciaSt. Vincent and the GrenadinesSub-Saharan Africa Sub-Saharan Africa (excluding high income)Sub-Saharan Africa (IDA & IBRD countries)SudanSurinameSwazilandSwedenSwitzerlandSyrian Arab RepublicTajikistanTanzaniaThailandTimor-LesteTogoTongaTrinidad and TobagoTunisiaTurkeyTurkmenistanTuvaluUgandaUkraineUnited Arab EmiratesUnited KingdomUnited StatesUpper middle incomeUruguayUzbekistanVanuatuVenezuela, RBVietnamWest Bank and GazaWorldYemen, Rep.ZambiaZimbabwe La ligne de temps
Cette échelle de temps montre un graphique de 1971 année à 2016 année Greece. Les données jusqu'à 1970 année ne sont pas présentés. Quantité d'observations actuelles selon dates: 45.
Source (désignation):
Les indicateurs du développement mondiale
Source (organisation):
International Monetary Fund, International Financial Statistics and Balance of Payments databases, World Bank, International Debt Statistics, and World Bank and OECD GDP estimates.
Catégories:
Economy & Growth, Financial Sector, Climate Change
Dernière mise à jour
23 avr. 2017
Les indicateurs de changement de valeurs selon les années
Minimum:
-0.006
1 janv. 2001
Maximum:
1.979
1 janv. 2007
Pour la date d''observation
Valeur
Changement absolu
Le changement par rapport à la valeur précédente
1 janv. 1971
0.381
+0.381
0.0%
1 janv. 1972
0.288
-0.093
-24.36%
1 janv. 1973
0.326
+0.038
13.16%
1 janv. 1974
0.277
-0.048
-14.83%
1 janv. 1975
0.264
-0.013
-4.74%
1 janv. 1976
0.084
-0.18
-68.17%
1 janv. 1977
0.979
+0.895
1.06 milles%
1 janv. 1978
1.07
+0.091
9.27%
1 janv. 1979
0.967
-0.103
-9.63%
1 janv. 1980
1.125
+0.158
16.38%
1 janv. 1981
1.182
+0.057
5.1%
1 janv. 1982
0.993
-0.189
-15.99%
1 janv. 1983
0.798
-0.195
-19.64%
1 janv. 1984
0.888
+0.09
11.26%
1 janv. 1985
1.01
+0.122
13.72%
1 janv. 1986
0.935
-0.075
-7.45%
1 janv. 1987
0.835
-0.099
-10.63%
1 janv. 1988
1.04
+0.205
24.53%
1 janv. 1989
1.189
+0.149
14.32%
1 janv. 1990
0.95
-0.239
-20.13%
1 janv. 1991
1.027
+0.077
8.08%
1 janv. 1992
1.079
+0.053
5.15%
1 janv. 1993
0.984
-0.095
-8.82%
1 janv. 1994
0.898
-0.086
-8.78%
1 janv. 1995
0.841
-0.057
-6.3%
1 janv. 1996
0.769
-0.072
-8.56%
1 janv. 1997
0.725
-0.044
-5.71%
1 janv. 1998
0.687
-0.038
-5.24%
1 janv. 2000
0.398
-0.289
-42.1%
1 janv. 2001
-0.006
-0.404
-101.58%
1 janv. 2002
0.001
+0.008
-123.31%
1 janv. 2003
0.022
+0.021
1.41 milles%
1 janv. 2004
0.697
+0.675
3.04 milles%
1 janv. 2005
0.893
+0.196
28.09%
1 janv. 2006
0.278
-0.614
-68.81%
1 janv. 2007
1.979
+1.701
610.75%
1 janv. 2008
0.615
-1.364
-68.94%
1 janv. 2009
1.618
+1.003
163.16%
1 janv. 2010
0.837
-0.78
-48.24%
1 janv. 2011
0.178
-0.659
-78.71%
1 janv. 2012
0.379
+0.201
112.88%
1 janv. 2013
0.677
+0.298
78.41%
1 janv. 2014
1.228
+0.551
81.37%
1 janv. 2015
1.142
-0.086
-6.97%
1 janv. 2016
0.586
-0.557
-48.74%
Classement des pays selon les statistiques actuelles par années


Commentaires: