29
/fr/
fr
AIzaSyAYiBZKx7MnpbEhh9jyipgxe19OcubqV5w
April 1, 2024
37678
IDA & IBRD total
IBT
false
2
1
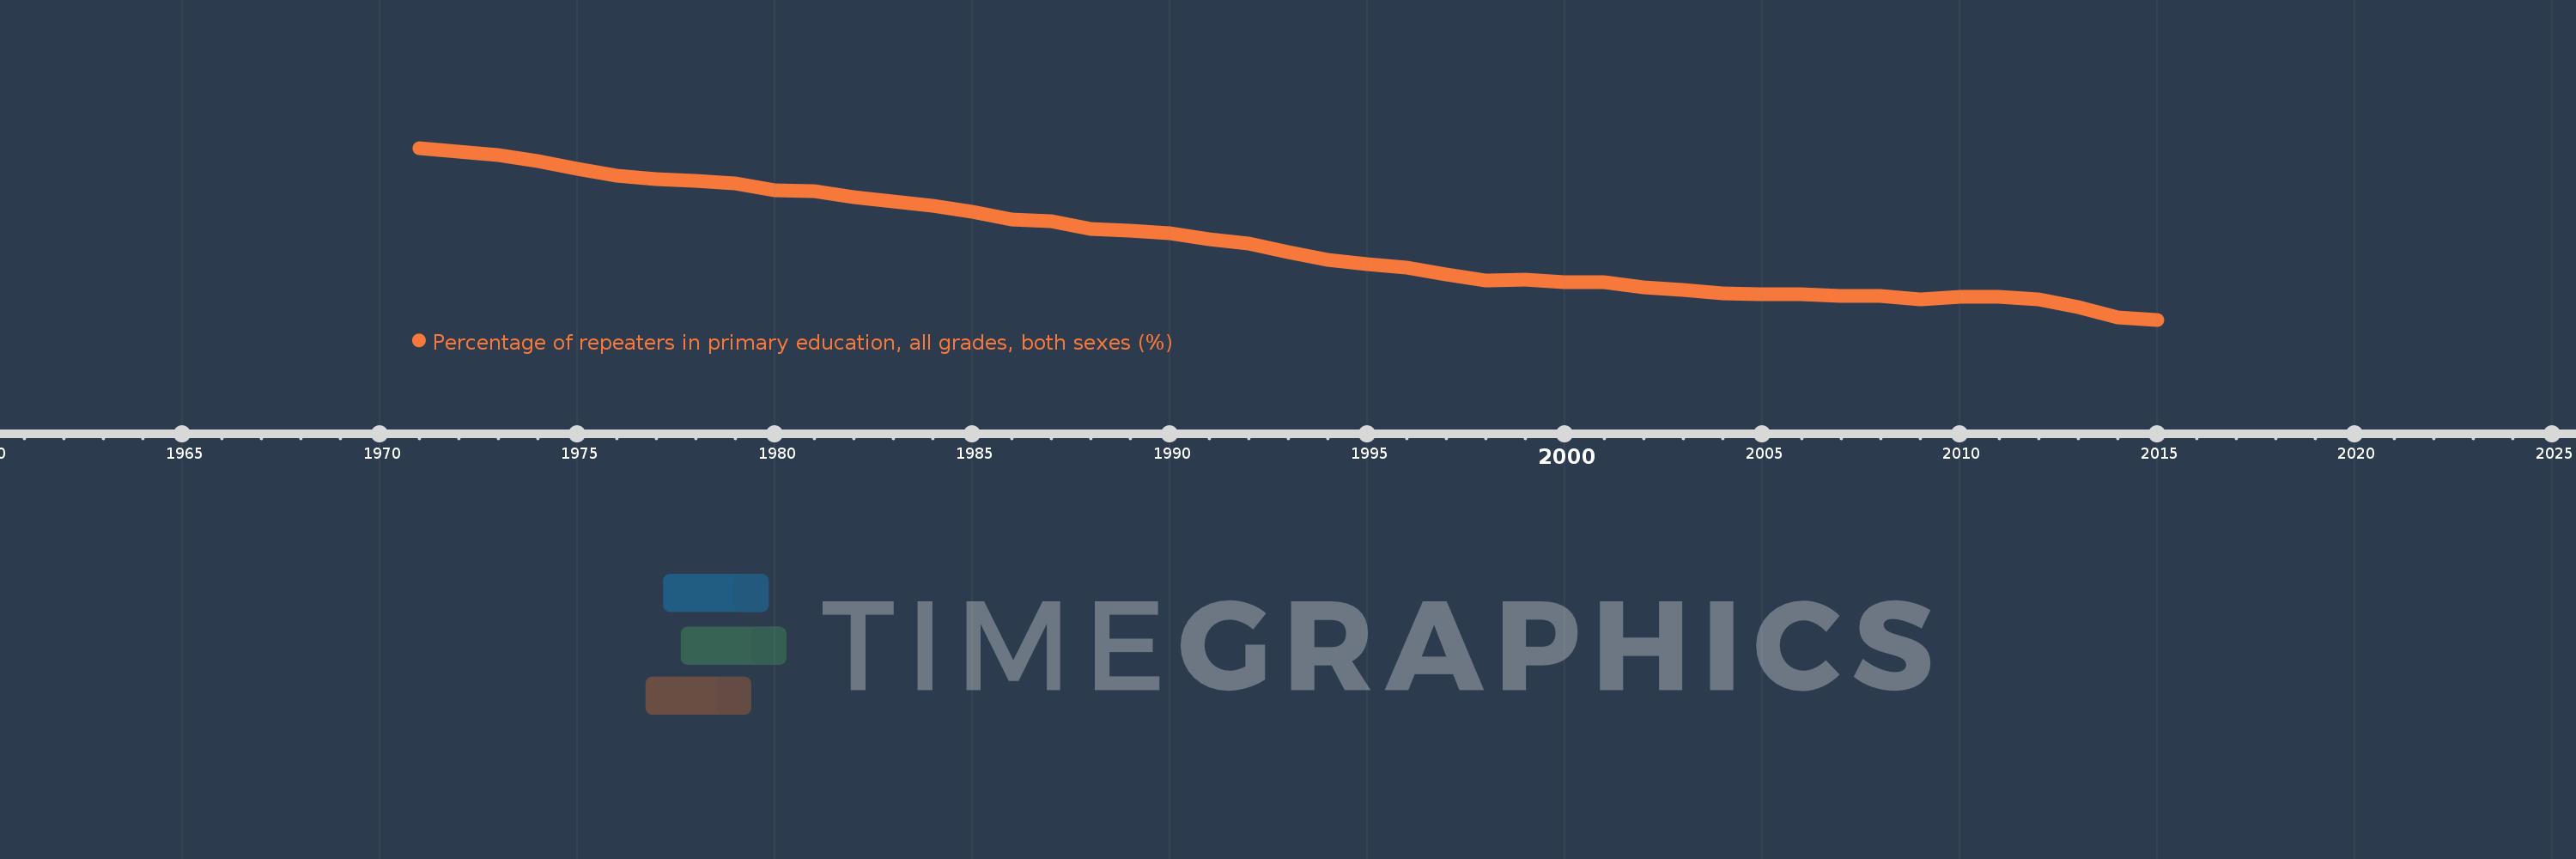
Percentage of repeaters in primary education, all grades, both sexes (%)
2015,2014,2013,2012,2011,2010,2009,2008,2007,2006,2005,2004,2003,2002,2001,2000,1999,1998,1997,1996,1995,1994,1993,1992,1991,1990,1989,1988,1987,1986,1985,1984,1983,1982,1981,1980,1979,1978,1977,1976,1975,1974,1973,1972,1971
Cette statistique dans les autres pays:
AfghanistanAlbaniaAlgeriaAndorraAngolaAntigua and BarbudaArab WorldArgentinaArmeniaArubaAustriaAzerbaijanBahamas, TheBahrainBangladeshBelarusBelgiumBelizeBeninBermudaBhutanBoliviaBosnia and HerzegovinaBotswanaBrazilBritish Virgin IslandsBrunei DarussalamBulgariaBurkina FasoBurundiCabo VerdeCambodiaCameroonCanadaCaribbean small statesCayman IslandsCentral African RepublicCentral Europe and the BalticsChadChileChinaColombiaComorosCongo, Dem. Rep.Congo, Rep.Costa RicaCote d'IvoireCroatiaCubaCyprusCzech RepublicDenmarkDjiboutiDominicaDominican RepublicEarly-demographic dividendEast Asia & PacificEast Asia & Pacific (excluding high income)East Asia & Pacific (IDA & IBRD countries)EcuadorEgypt, Arab Rep.El SalvadorEquatorial GuineaEritreaEstoniaEthiopiaEuro areaEurope & Central AsiaEurope & Central Asia (excluding high income)Europe & Central Asia (IDA & IBRD countries)European UnionFijiFinlandFragile and conflict affected situationsFranceGabonGambia, TheGeorgiaGermanyGhanaGreeceGrenadaGuatemalaGuineaGuinea-BissauGuyanaHaitiHeavily indebted poor countries (HIPC)High incomeHondurasHong Kong SAR, ChinaHungaryIBRD onlyIcelandIDA & IBRD totalIDA blendIDA onlyIDA totalIndiaIndonesiaIran, Islamic Rep.IraqIrelandIsraelItalyJamaicaJapanJordanKazakhstanKenyaKiribatiKorea, Rep.KuwaitKyrgyz RepublicLao PDRLate-demographic dividendLatin America & Caribbean Latin America & Caribbean (excluding high income)Latin America & the Caribbean (IDA & IBRD countries)LatviaLeast developed countries: UN classificationLebanonLesothoLiberiaLibyaLiechtensteinLithuaniaLow & middle incomeLow incomeLower middle incomeLuxembourgMacao SAR, ChinaMacedonia, FYRMadagascarMalawiMalaysiaMaldivesMaliMaltaMauritaniaMauritiusMexicoMiddle East & North AfricaMiddle East & North Africa (excluding high income)Middle East & North Africa (IDA & IBRD countries)Middle incomeMoldovaMonacoMongoliaMontenegroMoroccoMozambiqueMyanmarNamibiaNauruNepalNetherlandsNew ZealandNicaraguaNigerNorwayOECD membersOmanOther small statesPacific island small statesPakistanPalauPanamaPapua New GuineaParaguayPeruPhilippinesPolandPortugalPost-demographic dividendPre-demographic dividendQatarRomaniaRussian FederationRwandaSamoaSan MarinoSao Tome and PrincipeSaudi ArabiaSenegalSerbiaSeychellesSierra LeoneSingaporeSint Maarten (Dutch part)Slovak RepublicSloveniaSmall statesSolomon IslandsSomaliaSouth AfricaSouth AsiaSouth Asia (IDA & IBRD)South SudanSpainSri LankaSt. Kitts and NevisSt. LuciaSt. Vincent and the GrenadinesSub-Saharan Africa Sub-Saharan Africa (excluding high income)Sub-Saharan Africa (IDA & IBRD countries)SudanSurinameSwazilandSwedenSwitzerlandSyrian Arab RepublicTajikistanTanzaniaThailandTimor-LesteTogoTongaTrinidad and TobagoTunisiaTurkeyTurks and Caicos IslandsTuvaluUgandaUkraineUnited Arab EmiratesUnited KingdomUpper middle incomeUruguayUzbekistanVanuatuVenezuela, RBVietnamWest Bank and GazaWorldYemen, Rep.ZambiaZimbabwe La ligne de temps
Cette échelle de temps montre un graphique de 1971 année à 2015 année IDA & IBRD total. Les données jusqu'à 1970 année ne sont pas présentés. Quantité d'observations actuelles selon dates: 45.
Source (désignation):
Les indicateurs du développement mondiale
Source (organisation):
UNESCO Institute for Statistics
Catégories:
Education
Dernière mise à jour
23 avr. 2017
Les indicateurs de changement de valeurs selon les années
Minimum:
4.098
1 janv. 2015
Maximum:
11.526
1 janv. 1971
Pour la date d''observation
Valeur
Changement absolu
Le changement par rapport à la valeur précédente
1 janv. 1971
11.526
+11.526
0.0%
1 janv. 1972
11.353
-0.173
-1.5%
1 janv. 1973
11.222
-0.131
-1.16%
1 janv. 1974
10.941
-0.281
-2.5%
1 janv. 1975
10.616
-0.325
-2.97%
1 janv. 1976
10.342
-0.274
-2.58%
1 janv. 1977
10.185
-0.157
-1.52%
1 janv. 1978
10.088
-0.097
-0.95%
1 janv. 1979
10.007
-0.081
-0.8%
1 janv. 1980
9.693
-0.314
-3.14%
1 janv. 1981
9.668
-0.025
-0.26%
1 janv. 1982
9.387
-0.281
-2.91%
1 janv. 1983
9.225
-0.162
-1.73%
1 janv. 1984
9.028
-0.197
-2.14%
1 janv. 1985
8.763
-0.265
-2.94%
1 janv. 1986
8.423
-0.34
-3.88%
1 janv. 1987
8.375
-0.048
-0.57%
1 janv. 1988
8.009
-0.366
-4.37%
1 janv. 1989
7.936
-0.073
-0.92%
1 janv. 1990
7.824
-0.112
-1.41%
1 janv. 1991
7.564
-0.259
-3.31%
1 janv. 1992
7.398
-0.167
-2.2%
1 janv. 1993
7.006
-0.392
-5.29%
1 janv. 1994
6.686
-0.32
-4.57%
1 janv. 1995
6.512
-0.174
-2.6%
1 janv. 1996
6.353
-0.16
-2.45%
1 janv. 1997
6.073
-0.28
-4.4%
1 janv. 1998
5.787
-0.286
-4.71%
1 janv. 1999
5.822
+0.035
0.6%
1 janv. 2000
5.704
-0.118
-2.02%
1 janv. 2001
5.714
+0.01
0.17%
1 janv. 2002
5.485
-0.229
-4.01%
1 janv. 2003
5.403
-0.082
-1.49%
1 janv. 2004
5.244
-0.159
-2.94%
1 janv. 2005
5.201
-0.043
-0.83%
1 janv. 2006
5.219
+0.018
0.36%
1 janv. 2007
5.117
-0.102
-1.95%
1 janv. 2008
5.142
+0.024
0.47%
1 janv. 2009
4.975
-0.166
-3.23%
1 janv. 2010
5.09
+0.115
2.32%
1 janv. 2011
5.074
-0.017
-0.33%
1 janv. 2012
4.995
-0.079
-1.56%
1 janv. 2013
4.633
-0.362
-7.24%
1 janv. 2014
4.186
-0.447
-9.64%
1 janv. 2015
4.098
-0.088
-2.1%
Classement des pays selon les statistiques actuelles par années


Commentaires: