29
/fr/
fr
AIzaSyAYiBZKx7MnpbEhh9jyipgxe19OcubqV5w
April 1, 2024
210846
Nicaragua
NIC
true
2
1
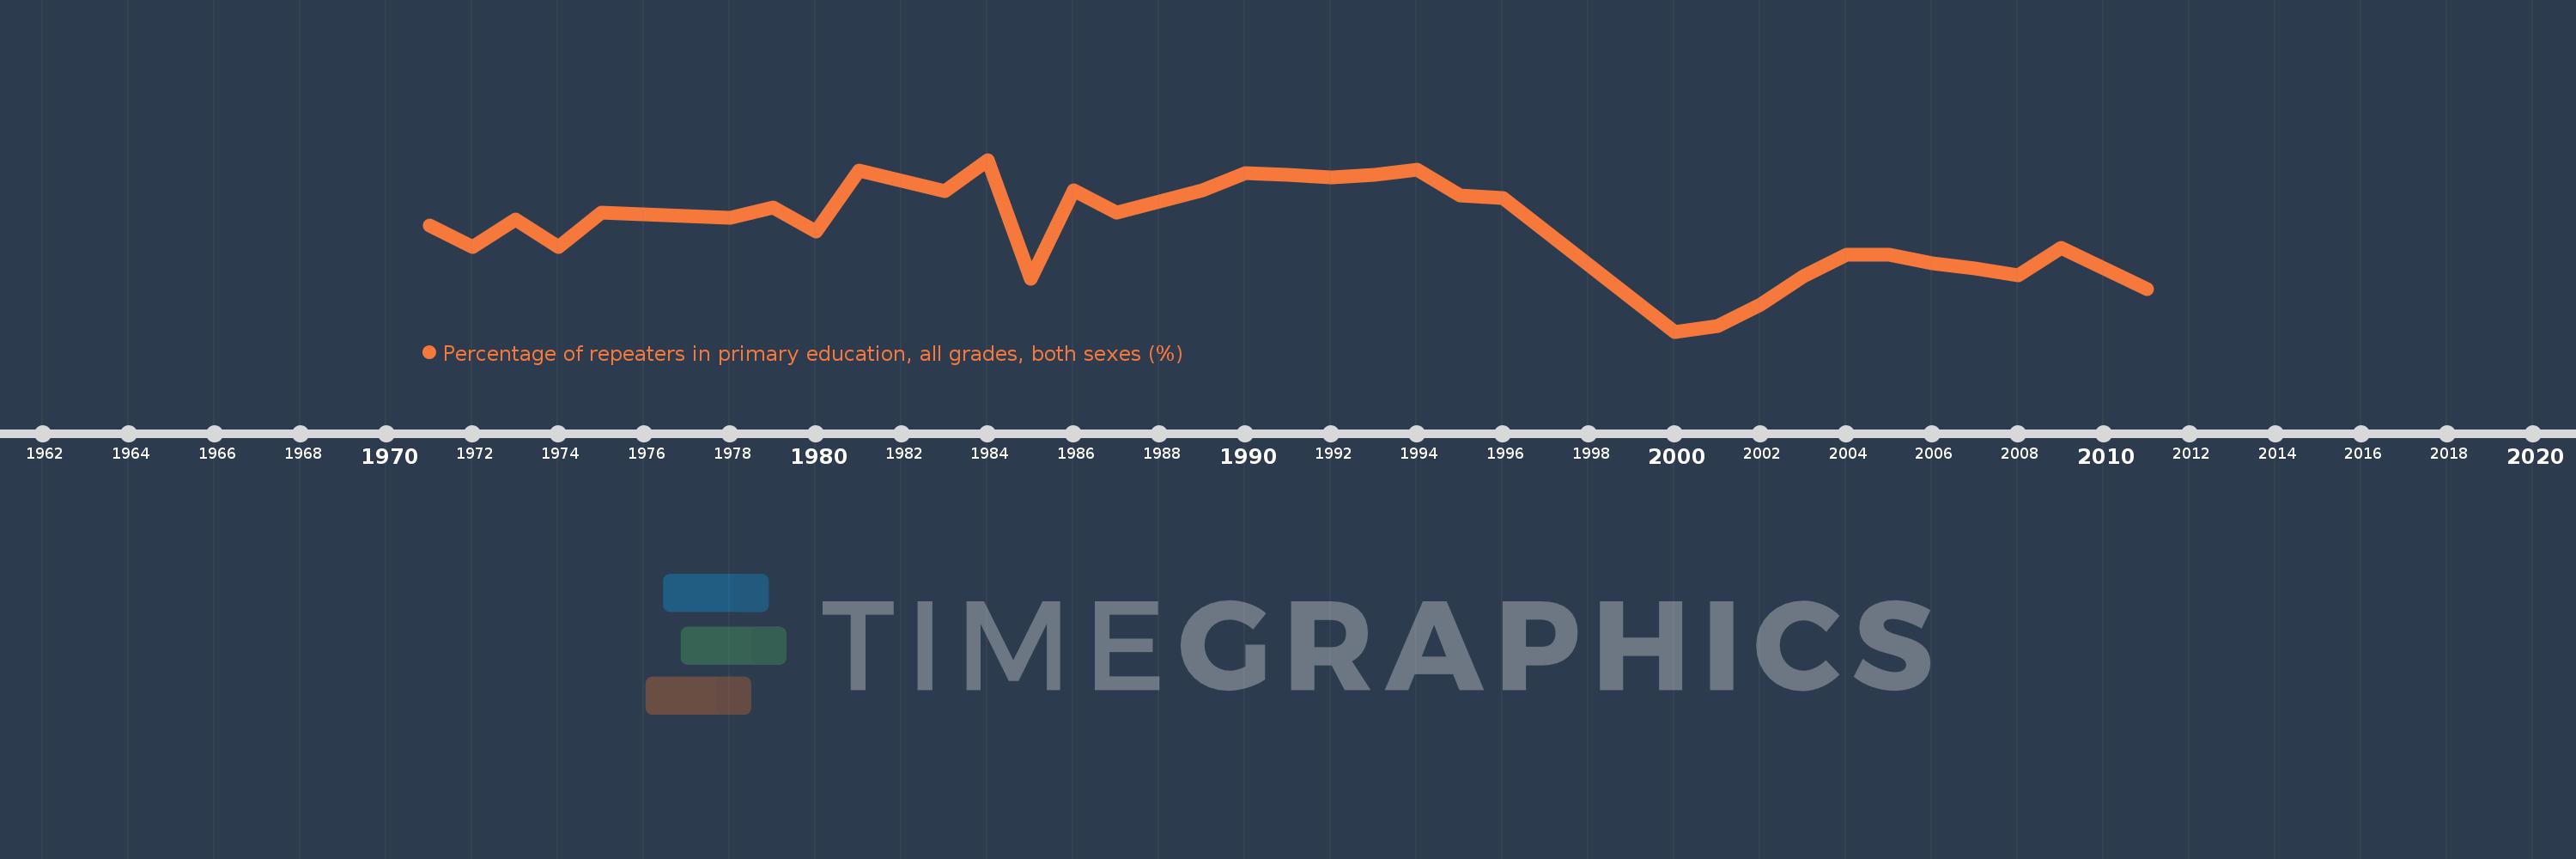
Percentage of repeaters in primary education, all grades, both sexes (%)
2011,2009,2008,2007,2006,2005,2004,2003,2002,2001,2000,1996,1995,1994,1993,1992,1991,1990,1989,1988,1987,1986,1985,1984,1983,1981,1980,1979,1978,1975,1974,1973,1972,1971
Cette statistique dans les autres pays:
AfghanistanAlbaniaAlgeriaAndorraAngolaAntigua and BarbudaArab WorldArgentinaArmeniaArubaAustriaAzerbaijanBahamas, TheBahrainBangladeshBelarusBelgiumBelizeBeninBermudaBhutanBoliviaBosnia and HerzegovinaBotswanaBrazilBritish Virgin IslandsBrunei DarussalamBulgariaBurkina FasoBurundiCabo VerdeCambodiaCameroonCanadaCaribbean small statesCayman IslandsCentral African RepublicCentral Europe and the BalticsChadChileChinaColombiaComorosCongo, Dem. Rep.Congo, Rep.Costa RicaCote d'IvoireCroatiaCubaCyprusCzech RepublicDenmarkDjiboutiDominicaDominican RepublicEarly-demographic dividendEast Asia & PacificEast Asia & Pacific (excluding high income)East Asia & Pacific (IDA & IBRD countries)EcuadorEgypt, Arab Rep.El SalvadorEquatorial GuineaEritreaEstoniaEthiopiaEuro areaEurope & Central AsiaEurope & Central Asia (excluding high income)Europe & Central Asia (IDA & IBRD countries)European UnionFijiFinlandFragile and conflict affected situationsFranceGabonGambia, TheGeorgiaGermanyGhanaGreeceGrenadaGuatemalaGuineaGuinea-BissauGuyanaHaitiHeavily indebted poor countries (HIPC)High incomeHondurasHong Kong SAR, ChinaHungaryIBRD onlyIcelandIDA & IBRD totalIDA blendIDA onlyIDA totalIndiaIndonesiaIran, Islamic Rep.IraqIrelandIsraelItalyJamaicaJapanJordanKazakhstanKenyaKiribatiKorea, Rep.KuwaitKyrgyz RepublicLao PDRLate-demographic dividendLatin America & Caribbean Latin America & Caribbean (excluding high income)Latin America & the Caribbean (IDA & IBRD countries)LatviaLeast developed countries: UN classificationLebanonLesothoLiberiaLibyaLiechtensteinLithuaniaLow & middle incomeLow incomeLower middle incomeLuxembourgMacao SAR, ChinaMacedonia, FYRMadagascarMalawiMalaysiaMaldivesMaliMaltaMauritaniaMauritiusMexicoMiddle East & North AfricaMiddle East & North Africa (excluding high income)Middle East & North Africa (IDA & IBRD countries)Middle incomeMoldovaMonacoMongoliaMontenegroMoroccoMozambiqueMyanmarNamibiaNauruNepalNetherlandsNew ZealandNicaraguaNigerNorwayOECD membersOmanOther small statesPacific island small statesPakistanPalauPanamaPapua New GuineaParaguayPeruPhilippinesPolandPortugalPost-demographic dividendPre-demographic dividendQatarRomaniaRussian FederationRwandaSamoaSan MarinoSao Tome and PrincipeSaudi ArabiaSenegalSerbiaSeychellesSierra LeoneSingaporeSint Maarten (Dutch part)Slovak RepublicSloveniaSmall statesSolomon IslandsSomaliaSouth AfricaSouth AsiaSouth Asia (IDA & IBRD)South SudanSpainSri LankaSt. Kitts and NevisSt. LuciaSt. Vincent and the GrenadinesSub-Saharan Africa Sub-Saharan Africa (excluding high income)Sub-Saharan Africa (IDA & IBRD countries)SudanSurinameSwazilandSwedenSwitzerlandSyrian Arab RepublicTajikistanTanzaniaThailandTimor-LesteTogoTongaTrinidad and TobagoTunisiaTurkeyTurks and Caicos IslandsTuvaluUgandaUkraineUnited Arab EmiratesUnited KingdomUpper middle incomeUruguayUzbekistanVanuatuVenezuela, RBVietnamWest Bank and GazaWorldYemen, Rep.ZambiaZimbabwe La ligne de temps
Cette échelle de temps montre un graphique de 1971 année à 2011 année Nicaragua. Les données jusqu'à 1970 année ne sont pas présentés. Quantité d'observations actuelles selon dates: 34.
Source (désignation):
Les indicateurs du développement mondiale
Source (organisation):
UNESCO Institute for Statistics
Catégories:
Education
Dernière mise à jour
23 avr. 2017
Les indicateurs de changement de valeurs selon les années
Minimum:
4.703
1 janv. 2000
Maximum:
17.726
1 janv. 1984
Pour la date d''observation
Valeur
Changement absolu
Le changement par rapport à la valeur précédente
1 janv. 1971
12.767
+12.767
0.0%
1 janv. 1972
11.112
-1.655
-12.96%
1 janv. 1973
13.212
+2.099
18.89%
1 janv. 1974
11.086
-2.126
-16.09%
1 janv. 1975
13.701
+2.615
23.59%
1 janv. 1978
13.341
-0.36
-2.63%
1 janv. 1979
14.112
+0.772
5.79%
1 janv. 1980
12.28
-1.832
-12.98%
1 janv. 1981
16.927
+4.648
37.85%
1 janv. 1983
15.323
-1.604
-9.48%
1 janv. 1984
17.726
+2.402
15.68%
1 janv. 1985
8.69
-9.036
-50.98%
1 janv. 1986
15.401
+6.711
77.23%
1 janv. 1987
13.701
-1.7
-11.04%
1 janv. 1988
14.577
+0.876
6.39%
1 janv. 1989
15.403
+0.827
5.67%
1 janv. 1990
16.724
+1.32
8.57%
1 janv. 1991
16.567
-0.156
-0.93%
1 janv. 1992
16.395
-0.172
-1.04%
1 janv. 1993
16.618
+0.223
1.36%
1 janv. 1994
16.992
+0.374
2.25%
1 janv. 1995
15.019
-1.973
-11.61%
1 janv. 1996
14.82
-0.199
-1.32%
1 janv. 2000
4.703
-10.117
-68.27%
1 janv. 2001
5.119
+0.416
8.85%
1 janv. 2002
6.732
+1.613
31.51%
1 janv. 2003
8.929
+2.197
32.64%
1 janv. 2004
10.543
+1.613
18.07%
1 janv. 2005
10.543
0.0
0.0%
1 janv. 2006
9.851
-0.691
-6.56%
1 janv. 2007
9.521
-0.33
-3.35%
1 janv. 2008
8.956
-0.566
-5.94%
1 janv. 2009
11.047
+2.092
23.35%
1 janv. 2011
7.94
-3.107
-28.12%
Classement des pays selon les statistiques actuelles par années


Commentaires: