29
/fr/
fr
AIzaSyAYiBZKx7MnpbEhh9jyipgxe19OcubqV5w
April 1, 2024
152941
Hungary
HUN
true
2
1
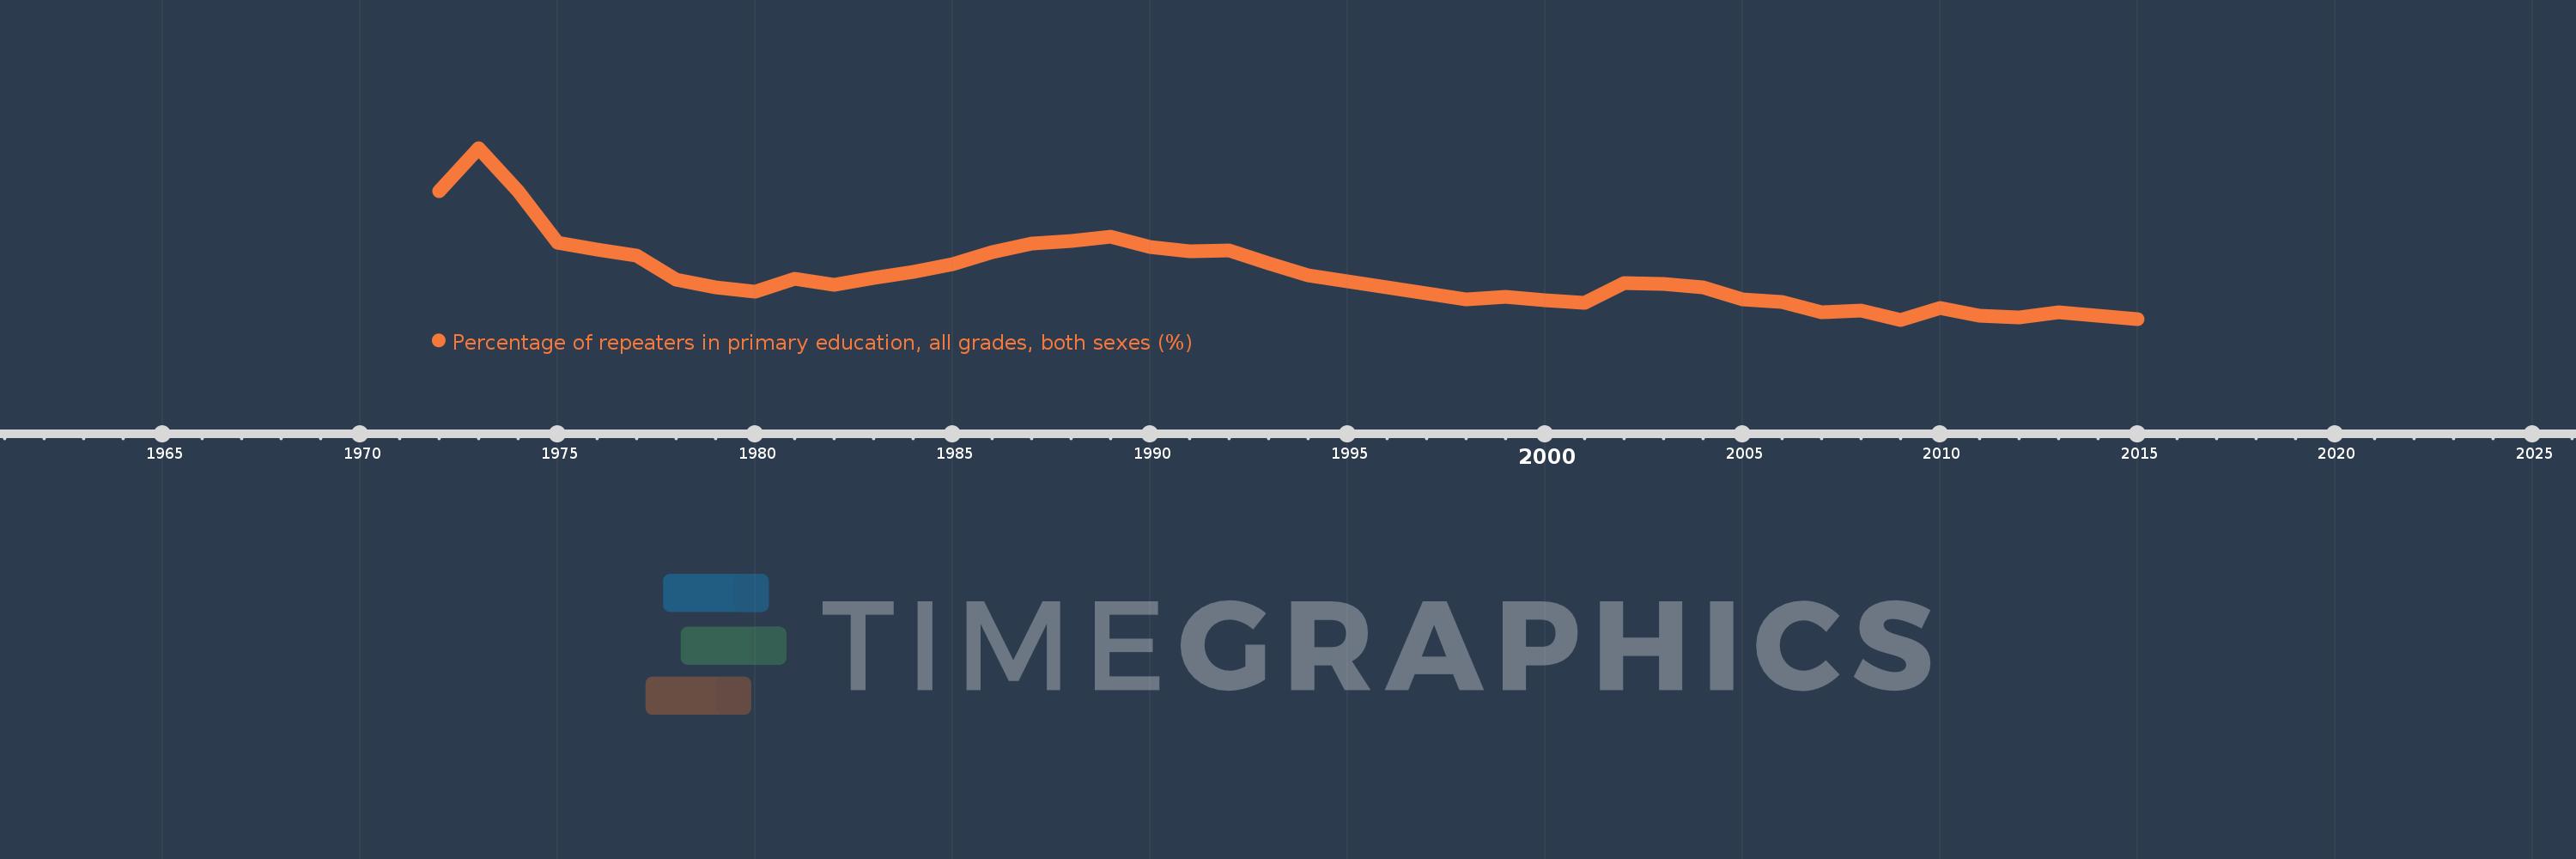
Percentage of repeaters in primary education, all grades, both sexes (%)
2015,2014,2013,2012,2011,2010,2009,2008,2007,2006,2005,2004,2003,2002,2001,2000,1999,1998,1994,1993,1992,1991,1990,1989,1988,1987,1986,1985,1984,1983,1982,1981,1980,1979,1978,1977,1976,1975,1974,1973,1972
Cette statistique dans les autres pays:
AfghanistanAlbaniaAlgeriaAndorraAngolaAntigua and BarbudaArab WorldArgentinaArmeniaArubaAustriaAzerbaijanBahamas, TheBahrainBangladeshBelarusBelgiumBelizeBeninBermudaBhutanBoliviaBosnia and HerzegovinaBotswanaBrazilBritish Virgin IslandsBrunei DarussalamBulgariaBurkina FasoBurundiCabo VerdeCambodiaCameroonCanadaCaribbean small statesCayman IslandsCentral African RepublicCentral Europe and the BalticsChadChileChinaColombiaComorosCongo, Dem. Rep.Congo, Rep.Costa RicaCote d'IvoireCroatiaCubaCyprusCzech RepublicDenmarkDjiboutiDominicaDominican RepublicEarly-demographic dividendEast Asia & PacificEast Asia & Pacific (excluding high income)East Asia & Pacific (IDA & IBRD countries)EcuadorEgypt, Arab Rep.El SalvadorEquatorial GuineaEritreaEstoniaEthiopiaEuro areaEurope & Central AsiaEurope & Central Asia (excluding high income)Europe & Central Asia (IDA & IBRD countries)European UnionFijiFinlandFragile and conflict affected situationsFranceGabonGambia, TheGeorgiaGermanyGhanaGreeceGrenadaGuatemalaGuineaGuinea-BissauGuyanaHaitiHeavily indebted poor countries (HIPC)High incomeHondurasHong Kong SAR, ChinaHungaryIBRD onlyIcelandIDA & IBRD totalIDA blendIDA onlyIDA totalIndiaIndonesiaIran, Islamic Rep.IraqIrelandIsraelItalyJamaicaJapanJordanKazakhstanKenyaKiribatiKorea, Rep.KuwaitKyrgyz RepublicLao PDRLate-demographic dividendLatin America & Caribbean Latin America & Caribbean (excluding high income)Latin America & the Caribbean (IDA & IBRD countries)LatviaLeast developed countries: UN classificationLebanonLesothoLiberiaLibyaLiechtensteinLithuaniaLow & middle incomeLow incomeLower middle incomeLuxembourgMacao SAR, ChinaMacedonia, FYRMadagascarMalawiMalaysiaMaldivesMaliMaltaMauritaniaMauritiusMexicoMiddle East & North AfricaMiddle East & North Africa (excluding high income)Middle East & North Africa (IDA & IBRD countries)Middle incomeMoldovaMonacoMongoliaMontenegroMoroccoMozambiqueMyanmarNamibiaNauruNepalNetherlandsNew ZealandNicaraguaNigerNorwayOECD membersOmanOther small statesPacific island small statesPakistanPalauPanamaPapua New GuineaParaguayPeruPhilippinesPolandPortugalPost-demographic dividendPre-demographic dividendQatarRomaniaRussian FederationRwandaSamoaSan MarinoSao Tome and PrincipeSaudi ArabiaSenegalSerbiaSeychellesSierra LeoneSingaporeSint Maarten (Dutch part)Slovak RepublicSloveniaSmall statesSolomon IslandsSomaliaSouth AfricaSouth AsiaSouth Asia (IDA & IBRD)South SudanSpainSri LankaSt. Kitts and NevisSt. LuciaSt. Vincent and the GrenadinesSub-Saharan Africa Sub-Saharan Africa (excluding high income)Sub-Saharan Africa (IDA & IBRD countries)SudanSurinameSwazilandSwedenSwitzerlandSyrian Arab RepublicTajikistanTanzaniaThailandTimor-LesteTogoTongaTrinidad and TobagoTunisiaTurkeyTurks and Caicos IslandsTuvaluUgandaUkraineUnited Arab EmiratesUnited KingdomUpper middle incomeUruguayUzbekistanVanuatuVenezuela, RBVietnamWest Bank and GazaWorldYemen, Rep.ZambiaZimbabwe La ligne de temps
Cette échelle de temps montre un graphique de 1972 année à 2015 année Hungary. Les données jusqu'à 1971 année ne sont pas présentés. Quantité d'observations actuelles selon dates: 41.
Source (désignation):
Les indicateurs du développement mondiale
Source (organisation):
UNESCO Institute for Statistics
Catégories:
Education
Dernière mise à jour
23 avr. 2017
Les indicateurs de changement de valeurs selon les années
Minimum:
1.726
1 janv. 2009
Maximum:
5.507
1 janv. 1973
Pour la date d''observation
Valeur
Changement absolu
Le changement par rapport à la valeur précédente
1 janv. 1972
4.554
+4.554
0.0%
1 janv. 1973
5.507
+0.952
20.91%
1 janv. 1974
4.548
-0.959
-17.42%
1 janv. 1975
3.424
-1.124
-24.71%
1 janv. 1976
3.275
-0.149
-4.34%
1 janv. 1977
3.129
-0.147
-4.48%
1 janv. 1978
2.615
-0.513
-16.41%
1 janv. 1979
2.442
-0.174
-6.64%
1 janv. 1980
2.353
-0.088
-3.62%
1 janv. 1981
2.621
+0.268
11.39%
1 janv. 1982
2.487
-0.134
-5.12%
1 janv. 1983
2.652
+0.164
6.61%
1 janv. 1984
2.782
+0.13
4.9%
1 janv. 1985
2.948
+0.167
5.99%
1 janv. 1986
3.205
+0.257
8.7%
1 janv. 1987
3.398
+0.193
6.02%
1 janv. 1988
3.456
+0.059
1.73%
1 janv. 1989
3.563
+0.107
3.09%
1 janv. 1990
3.335
-0.228
-6.41%
1 janv. 1991
3.23
-0.105
-3.15%
1 janv. 1992
3.243
+0.013
0.42%
1 janv. 1993
2.976
-0.267
-8.22%
1 janv. 1994
2.708
-0.269
-9.02%
1 janv. 1998
2.178
-0.53
-19.57%
1 janv. 1999
2.238
+0.06
2.77%
1 janv. 2000
2.16
-0.079
-3.51%
1 janv. 2001
2.106
-0.054
-2.51%
1 janv. 2002
2.537
+0.431
20.48%
1 janv. 2003
2.522
-0.015
-0.59%
1 janv. 2004
2.447
-0.075
-2.97%
1 janv. 2005
2.181
-0.266
-10.86%
1 janv. 2006
2.12
-0.061
-2.8%
1 janv. 2007
1.889
-0.231
-10.89%
1 janv. 2008
1.926
+0.037
1.96%
1 janv. 2009
1.726
-0.201
-10.41%
1 janv. 2010
1.99
+0.264
15.29%
1 janv. 2011
1.816
-0.174
-8.75%
1 janv. 2012
1.783
-0.032
-1.77%
1 janv. 2013
1.883
+0.1
5.61%
1 janv. 2014
1.819
-0.065
-3.43%
1 janv. 2015
1.731
-0.088
-4.84%
Classement des pays selon les statistiques actuelles par années


Commentaires: