29
/fr/
fr
AIzaSyAYiBZKx7MnpbEhh9jyipgxe19OcubqV5w
April 1, 2024
258766
Syrian Arab Republic
SYR
true
2
1
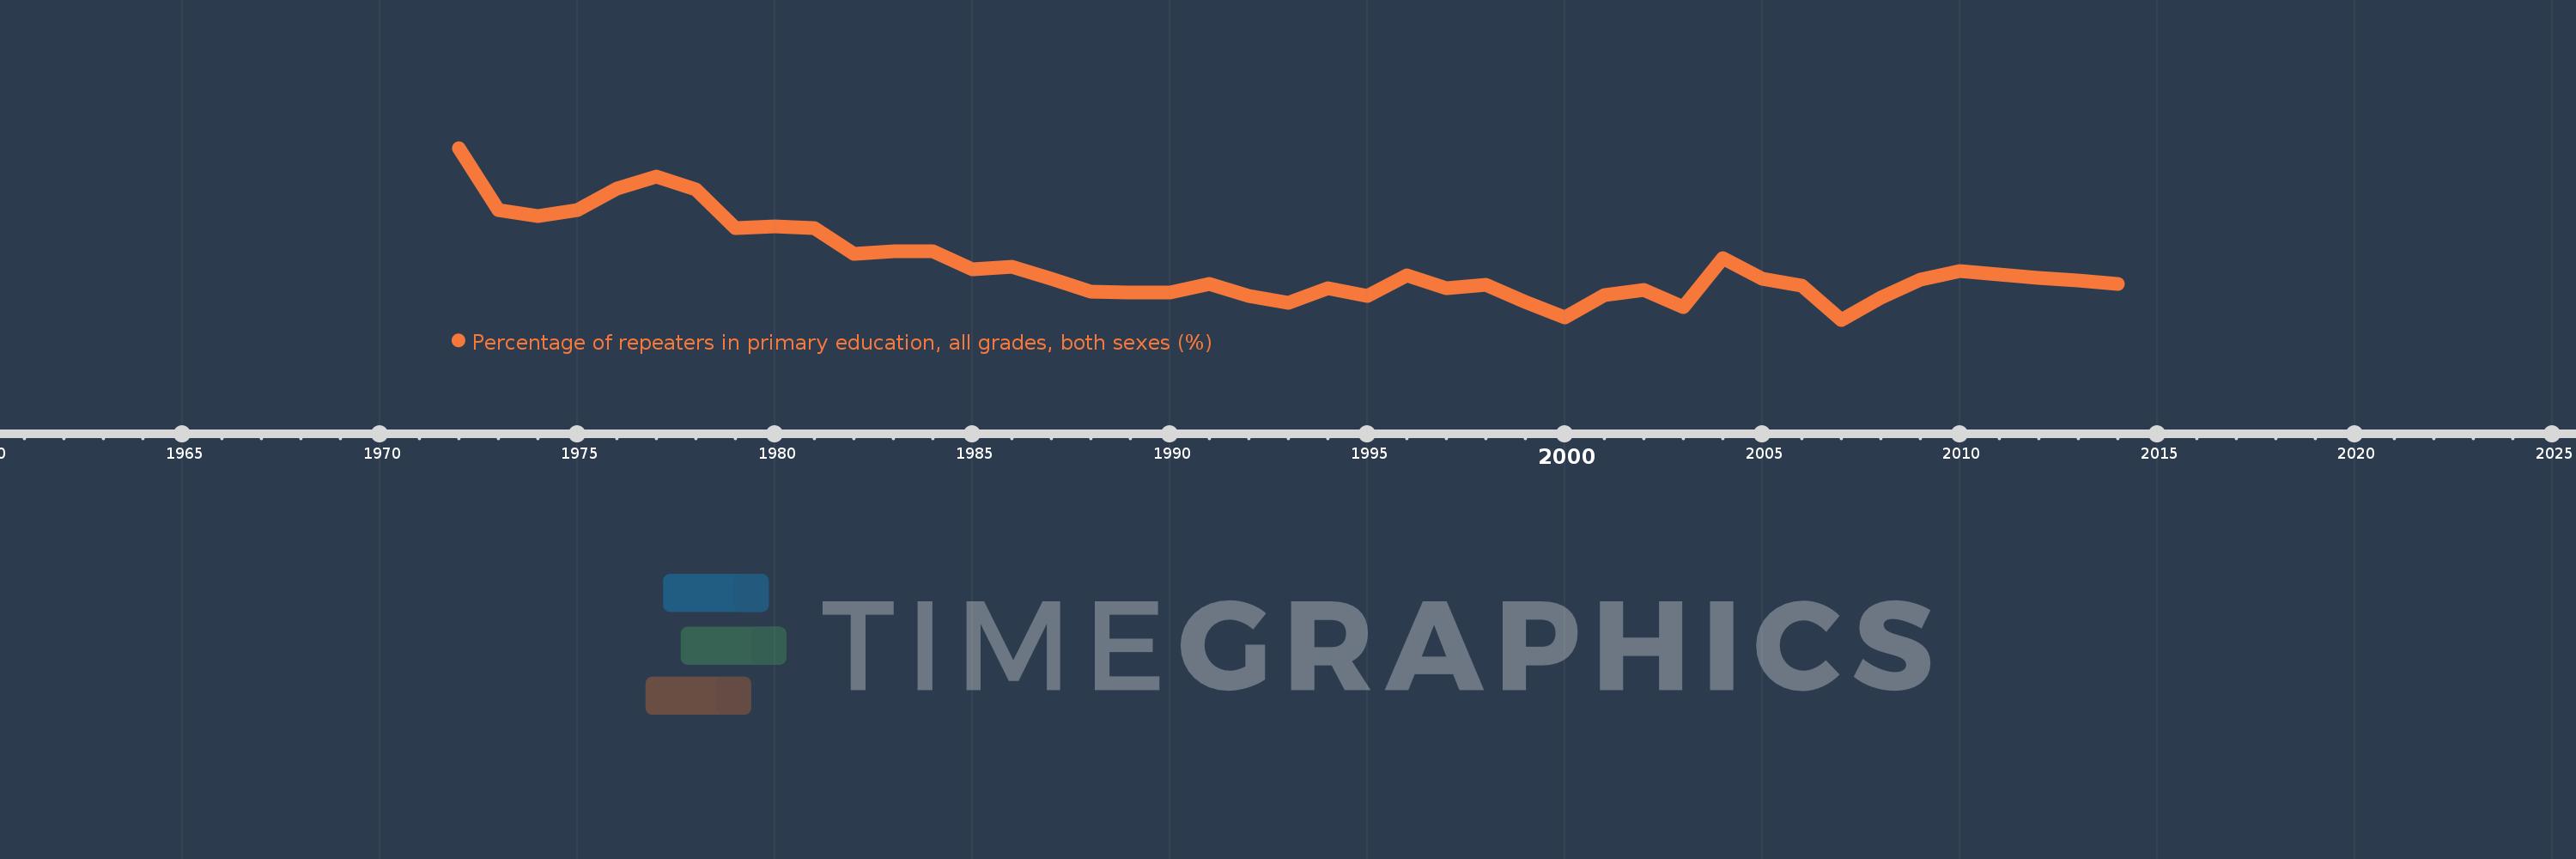
Percentage of repeaters in primary education, all grades, both sexes (%)
2014,2013,2012,2011,2010,2009,2008,2007,2006,2005,2004,2003,2002,2001,2000,1999,1998,1997,1996,1995,1994,1993,1992,1991,1990,1989,1988,1987,1986,1985,1984,1983,1982,1981,1980,1979,1978,1977,1976,1975,1974,1973,1972
Cette statistique dans les autres pays:
AfghanistanAlbaniaAlgeriaAndorraAngolaAntigua and BarbudaArab WorldArgentinaArmeniaArubaAustriaAzerbaijanBahamas, TheBahrainBangladeshBelarusBelgiumBelizeBeninBermudaBhutanBoliviaBosnia and HerzegovinaBotswanaBrazilBritish Virgin IslandsBrunei DarussalamBulgariaBurkina FasoBurundiCabo VerdeCambodiaCameroonCanadaCaribbean small statesCayman IslandsCentral African RepublicCentral Europe and the BalticsChadChileChinaColombiaComorosCongo, Dem. Rep.Congo, Rep.Costa RicaCote d'IvoireCroatiaCubaCyprusCzech RepublicDenmarkDjiboutiDominicaDominican RepublicEarly-demographic dividendEast Asia & PacificEast Asia & Pacific (excluding high income)East Asia & Pacific (IDA & IBRD countries)EcuadorEgypt, Arab Rep.El SalvadorEquatorial GuineaEritreaEstoniaEthiopiaEuro areaEurope & Central AsiaEurope & Central Asia (excluding high income)Europe & Central Asia (IDA & IBRD countries)European UnionFijiFinlandFragile and conflict affected situationsFranceGabonGambia, TheGeorgiaGermanyGhanaGreeceGrenadaGuatemalaGuineaGuinea-BissauGuyanaHaitiHeavily indebted poor countries (HIPC)High incomeHondurasHong Kong SAR, ChinaHungaryIBRD onlyIcelandIDA & IBRD totalIDA blendIDA onlyIDA totalIndiaIndonesiaIran, Islamic Rep.IraqIrelandIsraelItalyJamaicaJapanJordanKazakhstanKenyaKiribatiKorea, Rep.KuwaitKyrgyz RepublicLao PDRLate-demographic dividendLatin America & Caribbean Latin America & Caribbean (excluding high income)Latin America & the Caribbean (IDA & IBRD countries)LatviaLeast developed countries: UN classificationLebanonLesothoLiberiaLibyaLiechtensteinLithuaniaLow & middle incomeLow incomeLower middle incomeLuxembourgMacao SAR, ChinaMacedonia, FYRMadagascarMalawiMalaysiaMaldivesMaliMaltaMauritaniaMauritiusMexicoMiddle East & North AfricaMiddle East & North Africa (excluding high income)Middle East & North Africa (IDA & IBRD countries)Middle incomeMoldovaMonacoMongoliaMontenegroMoroccoMozambiqueMyanmarNamibiaNauruNepalNetherlandsNew ZealandNicaraguaNigerNorwayOECD membersOmanOther small statesPacific island small statesPakistanPalauPanamaPapua New GuineaParaguayPeruPhilippinesPolandPortugalPost-demographic dividendPre-demographic dividendQatarRomaniaRussian FederationRwandaSamoaSan MarinoSao Tome and PrincipeSaudi ArabiaSenegalSerbiaSeychellesSierra LeoneSingaporeSint Maarten (Dutch part)Slovak RepublicSloveniaSmall statesSolomon IslandsSomaliaSouth AfricaSouth AsiaSouth Asia (IDA & IBRD)South SudanSpainSri LankaSt. Kitts and NevisSt. LuciaSt. Vincent and the GrenadinesSub-Saharan Africa Sub-Saharan Africa (excluding high income)Sub-Saharan Africa (IDA & IBRD countries)SudanSurinameSwazilandSwedenSwitzerlandSyrian Arab RepublicTajikistanTanzaniaThailandTimor-LesteTogoTongaTrinidad and TobagoTunisiaTurkeyTurks and Caicos IslandsTuvaluUgandaUkraineUnited Arab EmiratesUnited KingdomUpper middle incomeUruguayUzbekistanVanuatuVenezuela, RBVietnamWest Bank and GazaWorldYemen, Rep.ZambiaZimbabwe La ligne de temps
Cette échelle de temps montre un graphique de 1972 année à 2014 année Syrian Arab Republic. Les données jusqu'à 1971 année ne sont pas présentés. Quantité d'observations actuelles selon dates: 43.
Source (désignation):
Les indicateurs du développement mondiale
Source (organisation):
UNESCO Institute for Statistics
Catégories:
Education
Dernière mise à jour
23 avr. 2017
Les indicateurs de changement de valeurs selon les années
Minimum:
6.416
1 janv. 2007
Maximum:
10.89
1 janv. 1972
Pour la date d''observation
Valeur
Changement absolu
Le changement par rapport à la valeur précédente
1 janv. 1972
10.89
+10.89
0.0%
1 janv. 1973
9.273
-1.617
-14.85%
1 janv. 1974
9.106
-0.167
-1.8%
1 janv. 1975
9.28
+0.174
1.91%
1 janv. 1976
9.833
+0.552
5.95%
1 janv. 1977
10.137
+0.304
3.09%
1 janv. 1978
9.82
-0.316
-3.12%
1 janv. 1979
8.805
-1.015
-10.33%
1 janv. 1980
8.837
+0.032
0.36%
1 janv. 1981
8.809
-0.028
-0.32%
1 janv. 1982
8.138
-0.67
-7.61%
1 janv. 1983
8.198
+0.059
0.73%
1 janv. 1984
8.206
+0.008
0.09%
1 janv. 1985
7.736
-0.47
-5.73%
1 janv. 1986
7.786
+0.05
0.65%
1 janv. 1987
7.483
-0.303
-3.89%
1 janv. 1988
7.141
-0.341
-4.56%
1 janv. 1989
7.124
-0.017
-0.24%
1 janv. 1990
7.119
-0.004
-0.06%
1 janv. 1991
7.338
+0.218
3.06%
1 janv. 1992
7.039
-0.298
-4.07%
1 janv. 1993
6.848
-0.191
-2.72%
1 janv. 1994
7.242
+0.395
5.76%
1 janv. 1995
7.033
-0.21
-2.89%
1 janv. 1996
7.565
+0.532
7.56%
1 janv. 1997
7.227
-0.337
-4.46%
1 janv. 1998
7.324
+0.096
1.33%
1 janv. 1999
6.868
-0.456
-6.22%
1 janv. 2000
6.483
-0.385
-5.6%
1 janv. 2001
7.068
+0.584
9.01%
1 janv. 2002
7.194
+0.126
1.78%
1 janv. 2003
6.752
-0.441
-6.14%
1 janv. 2004
8.025
+1.272
18.84%
1 janv. 2005
7.478
-0.546
-6.81%
1 janv. 2006
7.309
-0.169
-2.26%
1 janv. 2007
6.416
-0.893
-12.22%
1 janv. 2008
6.986
+0.571
8.89%
1 janv. 2009
7.457
+0.471
6.74%
1 janv. 2010
7.695
+0.237
3.18%
1 janv. 2011
7.595
-0.1
-1.3%
1 janv. 2012
7.497
-0.098
-1.29%
1 janv. 2013
7.437
-0.06
-0.8%
1 janv. 2014
7.35
-0.087
-1.17%
Classement des pays selon les statistiques actuelles par années


Commentaires: