29
/fr/
fr
AIzaSyAYiBZKx7MnpbEhh9jyipgxe19OcubqV5w
April 1, 2024
272518
Uganda
UGA
true
2
1
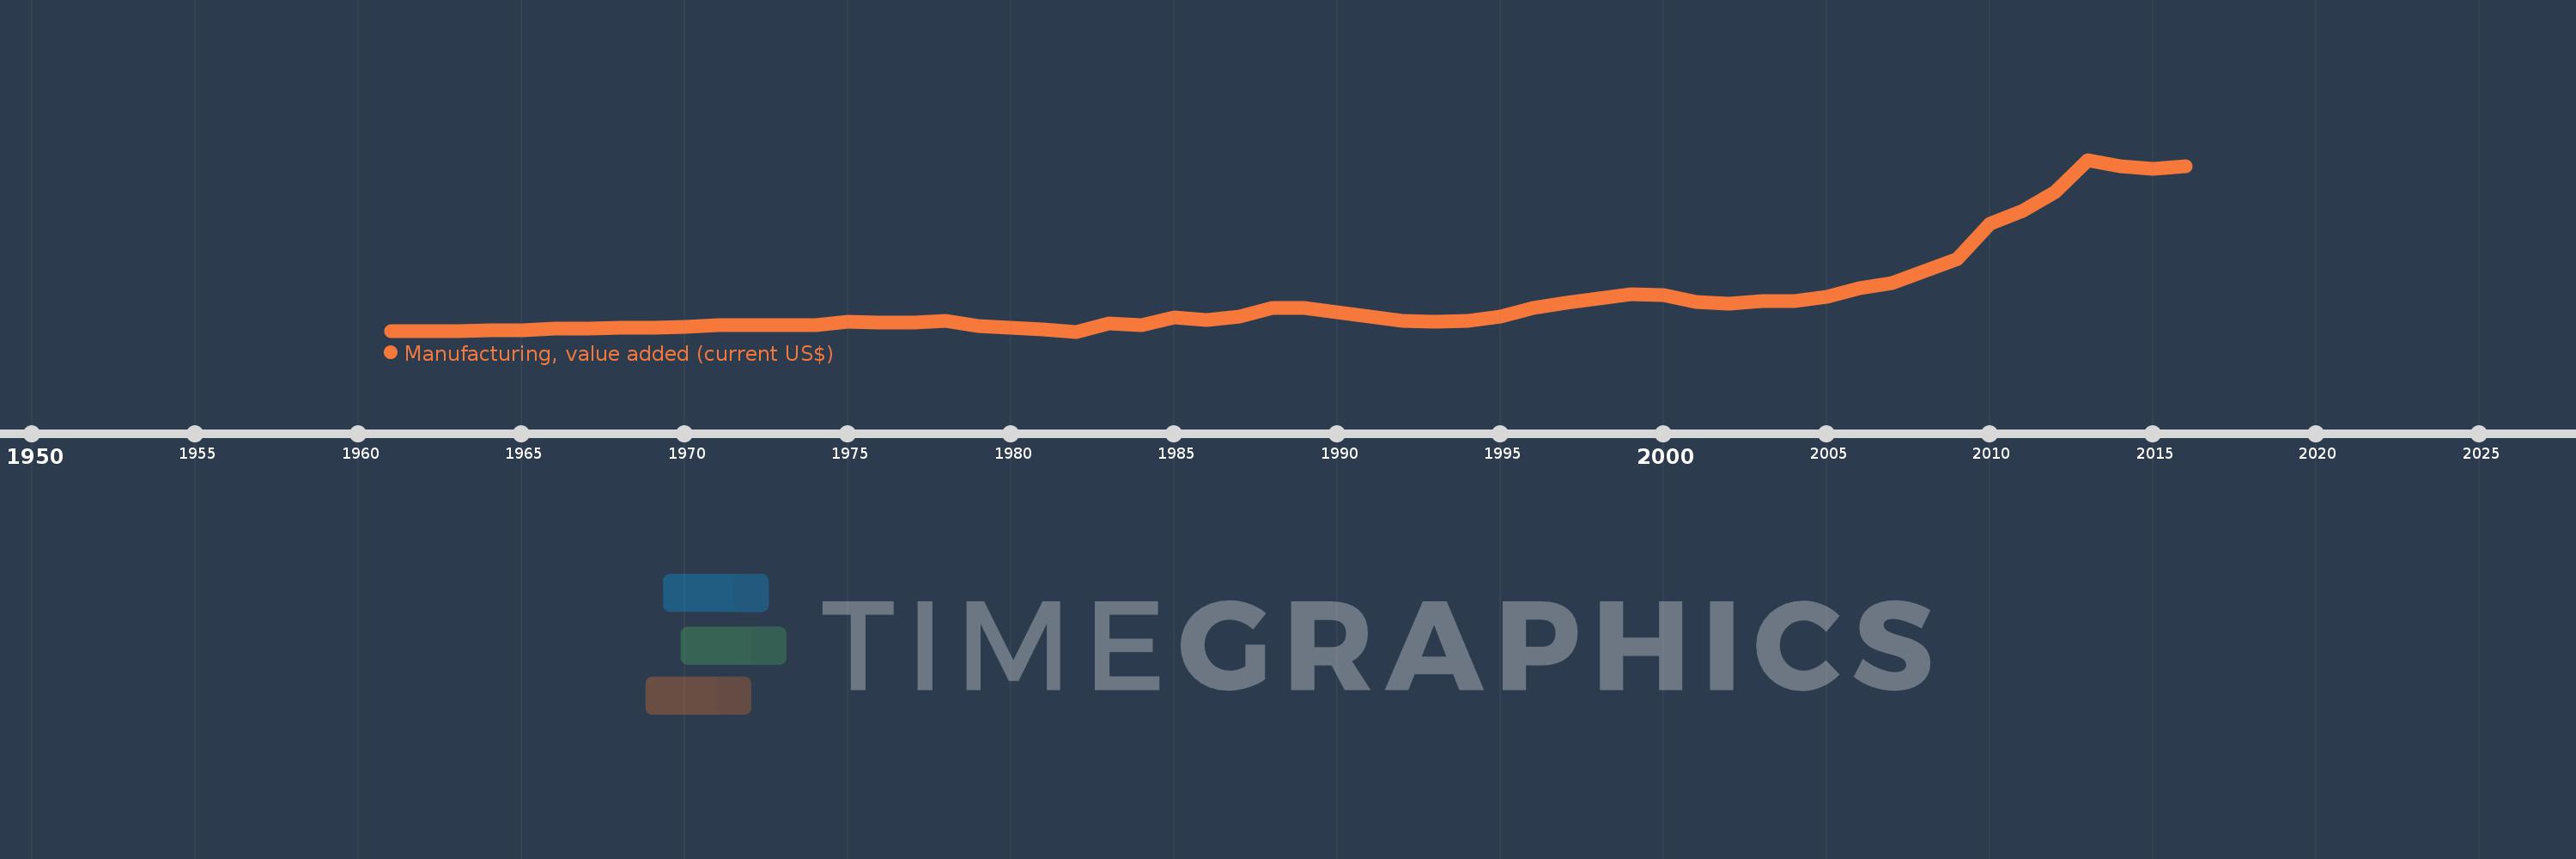
Manufacturing, value added (current US$)
2016,2015,2014,2013,2012,2011,2010,2009,2008,2007,2006,2005,2004,2003,2002,2001,2000,1999,1998,1997,1996,1995,1994,1993,1992,1991,1990,1989,1988,1987,1986,1985,1984,1983,1982,1981,1980,1979,1978,1977,1976,1975,1974,1973,1972,1971,1970,1969,1968,1967,1966,1965,1964,1963,1962,1961
Cette statistique dans les autres pays:
AfghanistanAlbaniaAlgeriaAndorraAngolaAntigua and BarbudaArab WorldArgentinaArmeniaArubaAustraliaAustriaAzerbaijanBahamas, TheBahrainBangladeshBarbadosBelarusBelgiumBelizeBeninBermudaBhutanBoliviaBosnia and HerzegovinaBotswanaBrazilBrunei DarussalamBurkina FasoBurundiCabo VerdeCambodiaCameroonCanadaCaribbean small statesCayman IslandsCentral African RepublicCentral Europe and the BalticsChadChileChinaColombiaComorosCongo, Dem. Rep.Congo, Rep.Costa RicaCote d'IvoireCroatiaCubaCyprusCzech RepublicDenmarkDjiboutiDominicaDominican RepublicEarly-demographic dividendEast Asia & PacificEast Asia & Pacific (excluding high income)East Asia & Pacific (IDA & IBRD countries)EcuadorEgypt, Arab Rep.El SalvadorEquatorial GuineaEritreaEstoniaEthiopiaEuro areaEurope & Central AsiaEurope & Central Asia (excluding high income)Europe & Central Asia (IDA & IBRD countries)European UnionFaroe IslandsFijiFinlandFragile and conflict affected situationsFranceGabonGambia, TheGeorgiaGermanyGhanaGreeceGrenadaGuatemalaGuineaGuinea-BissauGuyanaHeavily indebted poor countries (HIPC)High incomeHondurasHong Kong SAR, ChinaHungaryIBRD onlyIcelandIDA & IBRD totalIDA blendIDA onlyIDA totalIndiaIndonesiaIran, Islamic Rep.IraqIrelandItalyJamaicaJapanJordanKazakhstanKenyaKiribatiKorea, Rep.KosovoKuwaitKyrgyz RepublicLao PDRLate-demographic dividendLatin America & Caribbean Latin America & Caribbean (excluding high income)Latin America & the Caribbean (IDA & IBRD countries)LatviaLeast developed countries: UN classificationLebanonLesothoLiberiaLibyaLithuaniaLow & middle incomeLow incomeLower middle incomeLuxembourgMacao SAR, ChinaMacedonia, FYRMadagascarMalawiMalaysiaMaldivesMaliMaltaMarshall IslandsMauritaniaMauritiusMexicoMicronesia, Fed. Sts.Middle East & North AfricaMiddle East & North Africa (excluding high income)Middle East & North Africa (IDA & IBRD countries)Middle incomeMoldovaMongoliaMontenegroMoroccoMozambiqueMyanmarNamibiaNepalNetherlandsNew CaledoniaNew ZealandNicaraguaNigerNigeriaNorth AmericaNorwayOECD membersOmanOther small statesPacific island small statesPakistanPalauPanamaPapua New GuineaParaguayPeruPhilippinesPolandPortugalPost-demographic dividendPre-demographic dividendPuerto RicoQatarRomaniaRussian FederationRwandaSamoaSao Tome and PrincipeSaudi ArabiaSenegalSerbiaSeychellesSierra LeoneSingaporeSlovak RepublicSloveniaSmall statesSolomon IslandsSouth AfricaSouth AsiaSouth Asia (IDA & IBRD)SpainSri LankaSt. Kitts and NevisSt. LuciaSt. Vincent and the GrenadinesSub-Saharan Africa Sub-Saharan Africa (excluding high income)Sub-Saharan Africa (IDA & IBRD countries)SudanSurinameSwazilandSwedenSwitzerlandSyrian Arab RepublicTajikistanTanzaniaThailandTimor-LesteTogoTongaTrinidad and TobagoTunisiaTurkeyTurkmenistanTuvaluUgandaUkraineUnited Arab EmiratesUnited KingdomUnited StatesUpper middle incomeUruguayUzbekistanVanuatuVenezuela, RBVietnamWest Bank and GazaWorldYemen, Rep.ZambiaZimbabwe La ligne de temps
Cette échelle de temps montre un graphique de 1961 année à 2016 année Uganda. Les données jusqu'à 1960 année ne sont pas présentés. Quantité d'observations actuelles selon dates: 56.
Source (désignation):
Les indicateurs du développement mondiale
Source (organisation):
World Bank national accounts data, and OECD National Accounts data files.
Catégories:
Economy & Growth
Dernière mise à jour
23 avr. 2017
Les indicateurs de changement de valeurs selon les années
Minimum:
25.0 mln.
1 janv. 1982
Maximum:
2.427 mds
1 janv. 2013
Pour la date d''observation
Valeur
Changement absolu
Le changement par rapport à la valeur précédente
1 janv. 1961
34.468 mln.
+34.468 mln.
0.0%
1 janv. 1962
36.012 mln.
+1.544 mln.
4.48%
1 janv. 1963
32.621 mln.
-3.391 mln.
-9.42%
1 janv. 1964
42.492 mln.
+9.871 mln.
30.26%
1 janv. 1965
41.382 mln.
-1.11 mln.
-2.61%
1 janv. 1966
70.028 mln.
+28.646 mln.
69.23%
1 janv. 1967
70.588 mln.
+560.224 milles
0.8%
1 janv. 1968
73.249 mln.
+2.661 mln.
3.77%
1 janv. 1969
83.894 mln.
+10.644 mln.
14.53%
1 janv. 1970
96.078 mln.
+12.185 mln.
14.52%
1 janv. 1971
109.524 mln.
+13.445 mln.
13.99%
1 janv. 1972
112.045 mln.
+2.521 mln.
2.3%
1 janv. 1973
110.784 mln.
-1.261 mln.
-1.13%
1 janv. 1974
111.204 mln.
+420.168 milles
0.38%
1 janv. 1975
161.484 mln.
+50.279 mln.
45.21%
1 janv. 1976
146.333 mln.
-15.15 mln.
-9.38%
1 janv. 1977
146.3 mln.
-33.333 milles
-0.02%
1 janv. 1978
169.529 mln.
+23.229 mln.
15.88%
1 janv. 1979
106.304 mln.
-63.225 mln.
-37.29%
1 janv. 1980
78.45 mln.
-27.854 mln.
-26.2%
1 janv. 1981
53.03 mln.
-25.42 mln.
-32.4%
1 janv. 1982
25.0 mln.
-28.03 mln.
-52.86%
1 janv. 1983
136.0 mln.
+111.0 mln.
444.0%
1 janv. 1984
118.333 mln.
-17.667 mln.
-12.99%
1 janv. 1985
221.054 mln.
+102.721 mln.
86.81%
1 janv. 1986
187.632 mln.
-33.422 mln.
-15.12%
1 janv. 1987
237.327 mln.
+49.696 mln.
26.49%
1 janv. 1988
355.521 mln.
+118.194 mln.
49.8%
1 janv. 1989
360.2 mln.
+4.679 mln.
1.32%
1 janv. 1990
300.265 mln.
-59.935 mln.
-16.64%
1 janv. 1991
229.899 mln.
-70.366 mln.
-23.43%
1 janv. 1992
180.637 mln.
-49.262 mln.
-21.43%
1 janv. 1993
166.329 mln.
-14.307 mln.
-7.92%
1 janv. 1994
180.293 mln.
+13.964 mln.
8.4%
1 janv. 1995
240.638 mln.
+60.345 mln.
33.47%
1 janv. 1996
358.541 mln.
+117.903 mln.
49.0%
1 janv. 1997
432.012 mln.
+73.471 mln.
20.49%
1 janv. 1998
488.253 mln.
+56.241 mln.
13.02%
1 janv. 1999
545.295 mln.
+57.042 mln.
11.68%
1 janv. 2000
533.465 mln.
-11.831 mln.
-2.17%
1 janv. 2001
439.657 mln.
-93.807 mln.
-17.58%
1 janv. 2002
412.456 mln.
-27.202 mln.
-6.19%
1 janv. 2003
454.38 mln.
+41.925 mln.
10.16%
1 janv. 2004
447.097 mln.
-7.283 mln.
-1.6%
1 janv. 2005
505.399 mln.
+58.302 mln.
13.04%
1 janv. 2006
631.808 mln.
+126.409 mln.
25.01%
1 janv. 2007
704.991 mln.
+73.183 mln.
11.58%
1 janv. 2008
875.964 mln.
+170.973 mln.
24.25%
1 janv. 2009
1.04 mds
+164.477 mln.
18.78%
1 janv. 2010
1.532 mds
+491.217 mln.
47.21%
1 janv. 2011
1.716 mds
+184.309 mln.
12.03%
1 janv. 2012
1.972 mds
+255.801 mln.
14.91%
1 janv. 2013
2.427 mds
+455.186 mln.
23.09%
1 janv. 2014
2.335 mds
-92.052 mln.
-3.79%
1 janv. 2015
2.306 mds
-28.948 mln.
-1.24%
1 janv. 2016
2.331 mds
+25.367 mln.
1.1%
Classement des pays selon les statistiques actuelles par années


Commentaires: