29
/fr/
fr
AIzaSyAYiBZKx7MnpbEhh9jyipgxe19OcubqV5w
April 1, 2024
238465
Seychelles
SYC
true
2
1
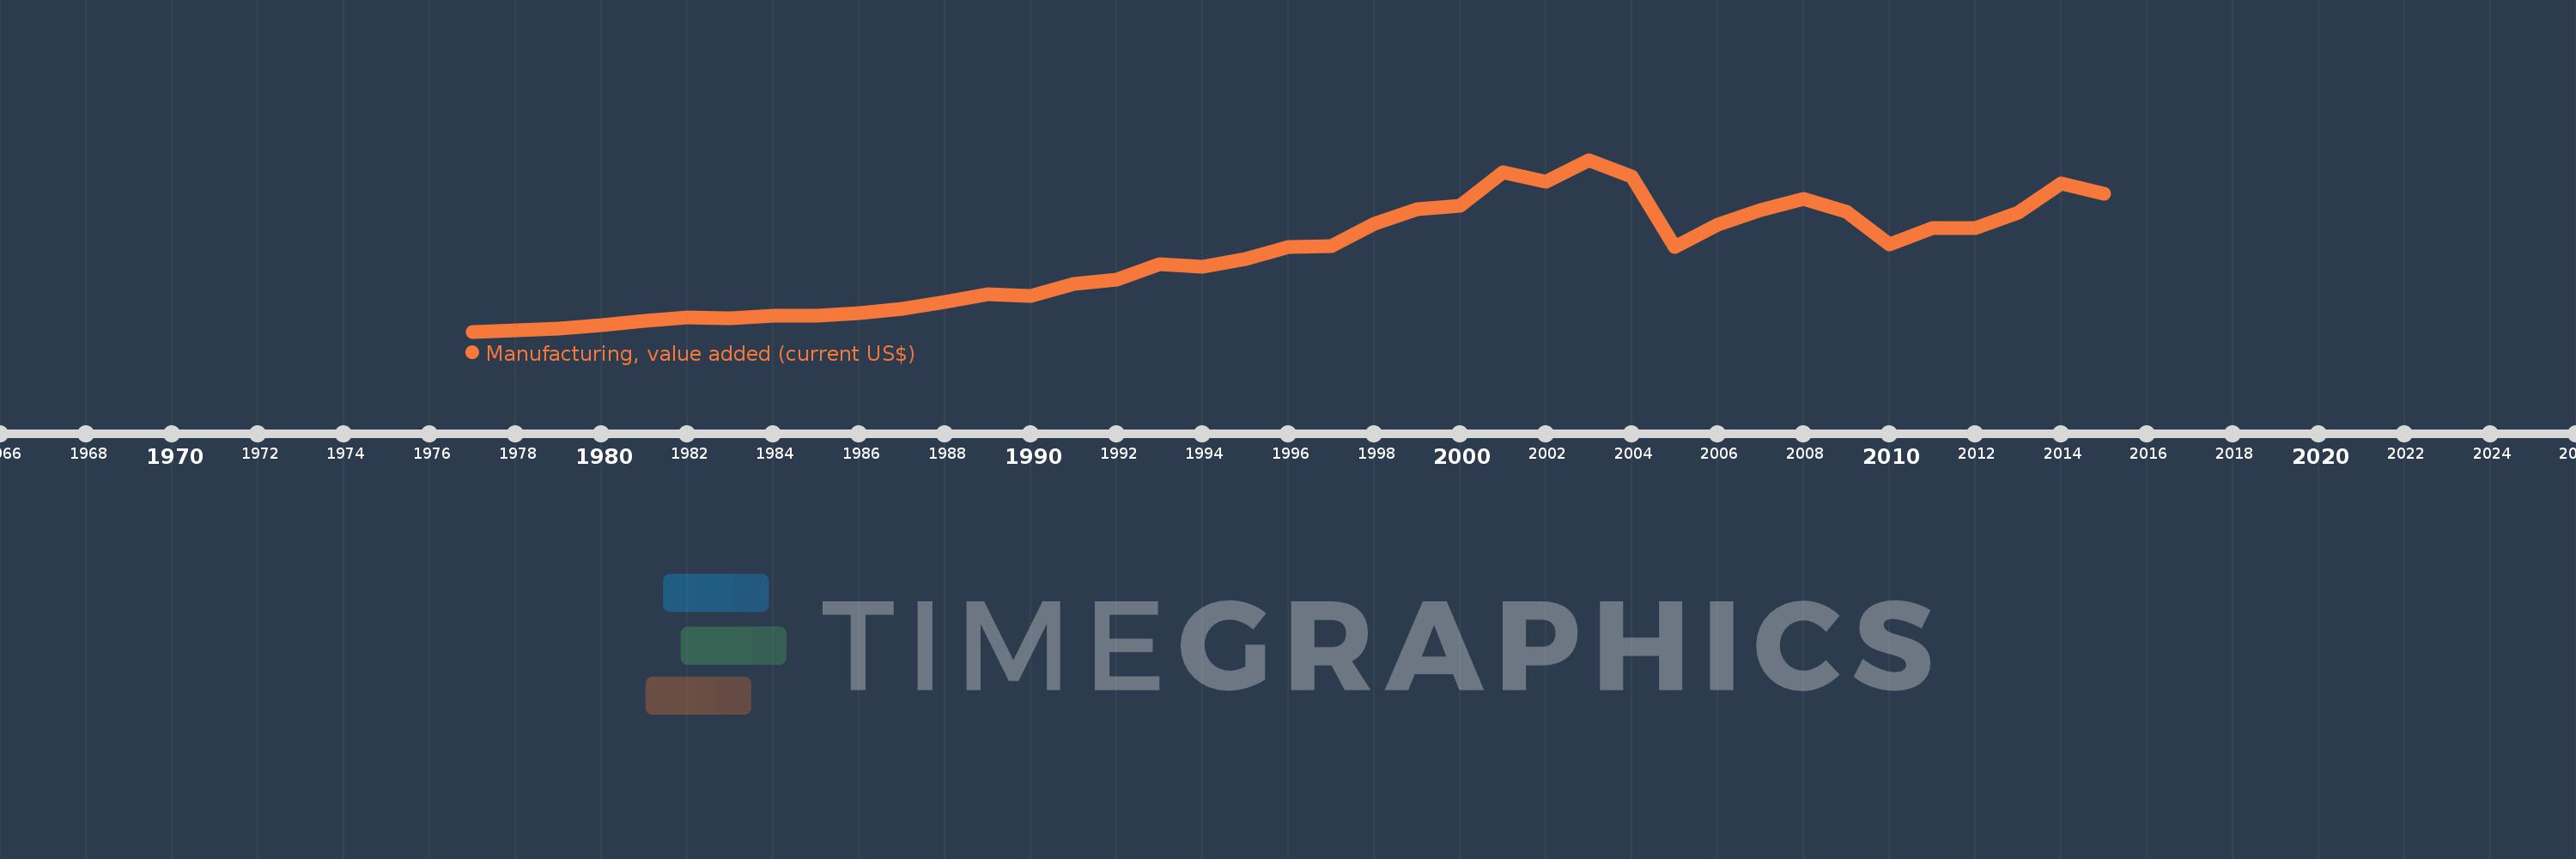
Manufacturing, value added (current US$)
2015,2014,2013,2012,2011,2010,2009,2008,2007,2006,2005,2004,2003,2002,2001,2000,1999,1998,1997,1996,1995,1994,1993,1992,1991,1990,1989,1988,1987,1986,1985,1984,1983,1982,1981,1980,1979,1978,1977
Cette statistique dans les autres pays:
AfghanistanAlbaniaAlgeriaAndorraAngolaAntigua and BarbudaArab WorldArgentinaArmeniaArubaAustraliaAustriaAzerbaijanBahamas, TheBahrainBangladeshBarbadosBelarusBelgiumBelizeBeninBermudaBhutanBoliviaBosnia and HerzegovinaBotswanaBrazilBrunei DarussalamBurkina FasoBurundiCabo VerdeCambodiaCameroonCanadaCaribbean small statesCayman IslandsCentral African RepublicCentral Europe and the BalticsChadChileChinaColombiaComorosCongo, Dem. Rep.Congo, Rep.Costa RicaCote d'IvoireCroatiaCubaCyprusCzech RepublicDenmarkDjiboutiDominicaDominican RepublicEarly-demographic dividendEast Asia & PacificEast Asia & Pacific (excluding high income)East Asia & Pacific (IDA & IBRD countries)EcuadorEgypt, Arab Rep.El SalvadorEquatorial GuineaEritreaEstoniaEthiopiaEuro areaEurope & Central AsiaEurope & Central Asia (excluding high income)Europe & Central Asia (IDA & IBRD countries)European UnionFaroe IslandsFijiFinlandFragile and conflict affected situationsFranceGabonGambia, TheGeorgiaGermanyGhanaGreeceGrenadaGuatemalaGuineaGuinea-BissauGuyanaHeavily indebted poor countries (HIPC)High incomeHondurasHong Kong SAR, ChinaHungaryIBRD onlyIcelandIDA & IBRD totalIDA blendIDA onlyIDA totalIndiaIndonesiaIran, Islamic Rep.IraqIrelandItalyJamaicaJapanJordanKazakhstanKenyaKiribatiKorea, Rep.KosovoKuwaitKyrgyz RepublicLao PDRLate-demographic dividendLatin America & Caribbean Latin America & Caribbean (excluding high income)Latin America & the Caribbean (IDA & IBRD countries)LatviaLeast developed countries: UN classificationLebanonLesothoLiberiaLibyaLithuaniaLow & middle incomeLow incomeLower middle incomeLuxembourgMacao SAR, ChinaMacedonia, FYRMadagascarMalawiMalaysiaMaldivesMaliMaltaMarshall IslandsMauritaniaMauritiusMexicoMicronesia, Fed. Sts.Middle East & North AfricaMiddle East & North Africa (excluding high income)Middle East & North Africa (IDA & IBRD countries)Middle incomeMoldovaMongoliaMontenegroMoroccoMozambiqueMyanmarNamibiaNepalNetherlandsNew CaledoniaNew ZealandNicaraguaNigerNigeriaNorth AmericaNorwayOECD membersOmanOther small statesPacific island small statesPakistanPalauPanamaPapua New GuineaParaguayPeruPhilippinesPolandPortugalPost-demographic dividendPre-demographic dividendPuerto RicoQatarRomaniaRussian FederationRwandaSamoaSao Tome and PrincipeSaudi ArabiaSenegalSerbiaSeychellesSierra LeoneSingaporeSlovak RepublicSloveniaSmall statesSolomon IslandsSouth AfricaSouth AsiaSouth Asia (IDA & IBRD)SpainSri LankaSt. Kitts and NevisSt. LuciaSt. Vincent and the GrenadinesSub-Saharan Africa Sub-Saharan Africa (excluding high income)Sub-Saharan Africa (IDA & IBRD countries)SudanSurinameSwazilandSwedenSwitzerlandSyrian Arab RepublicTajikistanTanzaniaThailandTimor-LesteTogoTongaTrinidad and TobagoTunisiaTurkeyTurkmenistanTuvaluUgandaUkraineUnited Arab EmiratesUnited KingdomUnited StatesUpper middle incomeUruguayUzbekistanVanuatuVenezuela, RBVietnamWest Bank and GazaWorldYemen, Rep.ZambiaZimbabwe La ligne de temps
Cette échelle de temps montre un graphique de 1977 année à 2015 année Seychelles. Les données jusqu'à 1976 année ne sont pas présentés. Quantité d'observations actuelles selon dates: 39.
Source (désignation):
Les indicateurs du développement mondiale
Source (organisation):
World Bank national accounts data, and OECD National Accounts data files.
Catégories:
Economy & Growth
Dernière mise à jour
23 avr. 2017
Les indicateurs de changement de valeurs selon les années
Minimum:
2.785 mln.
1 janv. 1977
Maximum:
127.372 mln.
1 janv. 2003
Pour la date d''observation
Valeur
Changement absolu
Le changement par rapport à la valeur précédente
1 janv. 1977
2.785 mln.
+2.785 mln.
0.0%
1 janv. 1978
3.519 mln.
+734.194 milles
26.36%
1 janv. 1979
5.236 mln.
+1.716 mln.
48.76%
1 janv. 1980
7.69 mln.
+2.455 mln.
46.89%
1 janv. 1981
10.873 mln.
+3.183 mln.
41.39%
1 janv. 1982
13.207 mln.
+2.334 mln.
21.46%
1 janv. 1983
12.606 mln.
-601.012 milles
-4.55%
1 janv. 1984
14.126 mln.
+1.52 mln.
12.06%
1 janv. 1985
14.209 mln.
+83.036 milles
0.59%
1 janv. 1986
16.315 mln.
+2.106 mln.
14.82%
1 janv. 1987
19.266 mln.
+2.95 mln.
18.08%
1 janv. 1988
24.411 mln.
+5.145 mln.
26.71%
1 janv. 1989
29.794 mln.
+5.384 mln.
22.05%
1 janv. 1990
28.747 mln.
-1.047 mln.
-3.51%
1 janv. 1991
37.213 mln.
+8.465 mln.
29.45%
1 janv. 1992
40.516 mln.
+3.303 mln.
8.88%
1 janv. 1993
51.602 mln.
+11.086 mln.
27.36%
1 janv. 1994
50.082 mln.
-1.52 mln.
-2.95%
1 janv. 1995
55.125 mln.
+5.043 mln.
10.07%
1 janv. 1996
64.344 mln.
+9.219 mln.
16.72%
1 janv. 1997
65.011 mln.
+667.304 milles
1.04%
1 janv. 1998
80.934 mln.
+15.923 mln.
24.49%
1 janv. 1999
91.617 mln.
+10.683 mln.
13.2%
1 janv. 2000
94.226 mln.
+2.608 mln.
2.85%
1 janv. 2001
118.118 mln.
+23.892 mln.
25.36%
1 janv. 2002
111.788 mln.
-6.329 mln.
-5.36%
1 janv. 2003
127.372 mln.
+15.584 mln.
13.94%
1 janv. 2004
115.392 mln.
-11.98 mln.
-9.41%
1 janv. 2005
64.274 mln.
-51.119 mln.
-44.3%
1 janv. 2006
80.36 mln.
+16.086 mln.
25.03%
1 janv. 2007
91.103 mln.
+10.743 mln.
13.37%
1 janv. 2008
98.95 mln.
+7.847 mln.
8.61%
1 janv. 2009
89.89 mln.
-9.06 mln.
-9.16%
1 janv. 2010
66.302 mln.
-23.589 mln.
-26.24%
1 janv. 2011
77.906 mln.
+11.604 mln.
17.5%
1 janv. 2012
77.886 mln.
-19.365 milles
-0.02%
1 janv. 2013
88.803 mln.
+10.917 mln.
14.02%
1 janv. 2014
110.085 mln.
+21.282 mln.
23.97%
1 janv. 2015
103.011 mln.
-7.074 mln.
-6.43%
Classement des pays selon les statistiques actuelles par années


Commentaires: