29
/fr/
fr
AIzaSyAYiBZKx7MnpbEhh9jyipgxe19OcubqV5w
April 1, 2024
126453
El Salvador
SLV
true
2
1
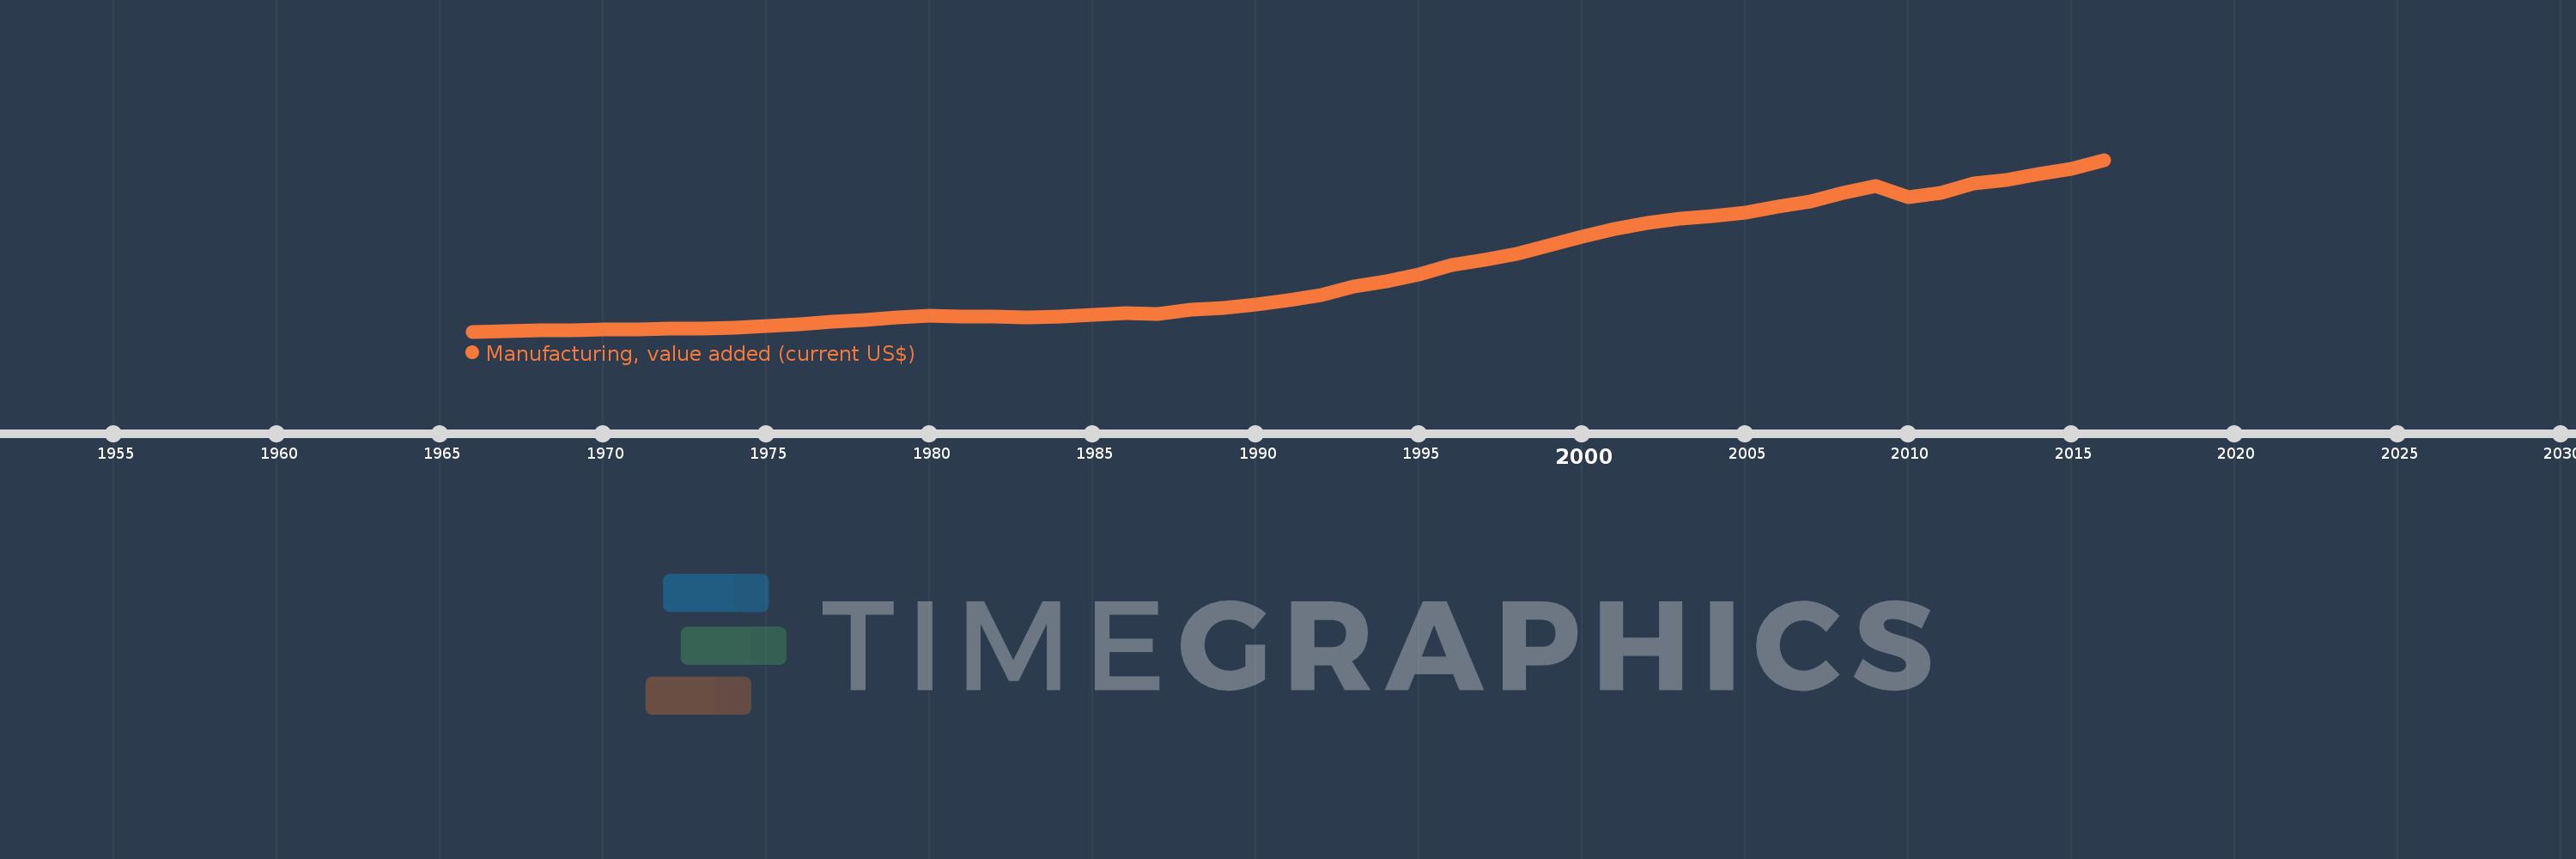
Manufacturing, value added (current US$)
2016,2015,2014,2013,2012,2011,2010,2009,2008,2007,2006,2005,2004,2003,2002,2001,2000,1999,1998,1997,1996,1995,1994,1993,1992,1991,1990,1989,1988,1987,1986,1985,1984,1983,1982,1981,1980,1979,1978,1977,1976,1975,1974,1973,1972,1971,1970,1969,1968,1967,1966
Cette statistique dans les autres pays:
AfghanistanAlbaniaAlgeriaAndorraAngolaAntigua and BarbudaArab WorldArgentinaArmeniaArubaAustraliaAustriaAzerbaijanBahamas, TheBahrainBangladeshBarbadosBelarusBelgiumBelizeBeninBermudaBhutanBoliviaBosnia and HerzegovinaBotswanaBrazilBrunei DarussalamBurkina FasoBurundiCabo VerdeCambodiaCameroonCanadaCaribbean small statesCayman IslandsCentral African RepublicCentral Europe and the BalticsChadChileChinaColombiaComorosCongo, Dem. Rep.Congo, Rep.Costa RicaCote d'IvoireCroatiaCubaCyprusCzech RepublicDenmarkDjiboutiDominicaDominican RepublicEarly-demographic dividendEast Asia & PacificEast Asia & Pacific (excluding high income)East Asia & Pacific (IDA & IBRD countries)EcuadorEgypt, Arab Rep.El SalvadorEquatorial GuineaEritreaEstoniaEthiopiaEuro areaEurope & Central AsiaEurope & Central Asia (excluding high income)Europe & Central Asia (IDA & IBRD countries)European UnionFaroe IslandsFijiFinlandFragile and conflict affected situationsFranceGabonGambia, TheGeorgiaGermanyGhanaGreeceGrenadaGuatemalaGuineaGuinea-BissauGuyanaHeavily indebted poor countries (HIPC)High incomeHondurasHong Kong SAR, ChinaHungaryIBRD onlyIcelandIDA & IBRD totalIDA blendIDA onlyIDA totalIndiaIndonesiaIran, Islamic Rep.IraqIrelandItalyJamaicaJapanJordanKazakhstanKenyaKiribatiKorea, Rep.KosovoKuwaitKyrgyz RepublicLao PDRLate-demographic dividendLatin America & Caribbean Latin America & Caribbean (excluding high income)Latin America & the Caribbean (IDA & IBRD countries)LatviaLeast developed countries: UN classificationLebanonLesothoLiberiaLibyaLithuaniaLow & middle incomeLow incomeLower middle incomeLuxembourgMacao SAR, ChinaMacedonia, FYRMadagascarMalawiMalaysiaMaldivesMaliMaltaMarshall IslandsMauritaniaMauritiusMexicoMicronesia, Fed. Sts.Middle East & North AfricaMiddle East & North Africa (excluding high income)Middle East & North Africa (IDA & IBRD countries)Middle incomeMoldovaMongoliaMontenegroMoroccoMozambiqueMyanmarNamibiaNepalNetherlandsNew CaledoniaNew ZealandNicaraguaNigerNigeriaNorth AmericaNorwayOECD membersOmanOther small statesPacific island small statesPakistanPalauPanamaPapua New GuineaParaguayPeruPhilippinesPolandPortugalPost-demographic dividendPre-demographic dividendPuerto RicoQatarRomaniaRussian FederationRwandaSamoaSao Tome and PrincipeSaudi ArabiaSenegalSerbiaSeychellesSierra LeoneSingaporeSlovak RepublicSloveniaSmall statesSolomon IslandsSouth AfricaSouth AsiaSouth Asia (IDA & IBRD)SpainSri LankaSt. Kitts and NevisSt. LuciaSt. Vincent and the GrenadinesSub-Saharan Africa Sub-Saharan Africa (excluding high income)Sub-Saharan Africa (IDA & IBRD countries)SudanSurinameSwazilandSwedenSwitzerlandSyrian Arab RepublicTajikistanTanzaniaThailandTimor-LesteTogoTongaTrinidad and TobagoTunisiaTurkeyTurkmenistanTuvaluUgandaUkraineUnited Arab EmiratesUnited KingdomUnited StatesUpper middle incomeUruguayUzbekistanVanuatuVenezuela, RBVietnamWest Bank and GazaWorldYemen, Rep.ZambiaZimbabwe La ligne de temps
Cette échelle de temps montre un graphique de 1966 année à 2016 année El Salvador. Les données jusqu'à 1965 année ne sont pas présentés. Quantité d'observations actuelles selon dates: 51.
Source (désignation):
Les indicateurs du développement mondiale
Source (organisation):
World Bank national accounts data, and OECD National Accounts data files.
Catégories:
Economy & Growth
Dernière mise à jour
23 avr. 2017
Les indicateurs de changement de valeurs selon les années
Minimum:
166.2 mln.
1 janv. 1966
Maximum:
4.96 mds
1 janv. 2016
Pour la date d''observation
Valeur
Changement absolu
Le changement par rapport à la valeur précédente
1 janv. 1966
166.2 mln.
+166.2 mln.
0.0%
1 janv. 1967
187.16 mln.
+20.96 mln.
12.61%
1 janv. 1968
199.28 mln.
+12.12 mln.
6.48%
1 janv. 1969
211.4 mln.
+12.12 mln.
6.08%
1 janv. 1970
220.0 mln.
+8.6 mln.
4.07%
1 janv. 1971
228.72 mln.
+8.72 mln.
3.96%
1 janv. 1972
244.08 mln.
+15.36 mln.
6.72%
1 janv. 1973
262.0 mln.
+17.92 mln.
7.34%
1 janv. 1974
285.8 mln.
+23.8 mln.
9.08%
1 janv. 1975
331.6 mln.
+45.8 mln.
16.03%
1 janv. 1976
377.4 mln.
+45.8 mln.
13.81%
1 janv. 1977
430.56 mln.
+53.16 mln.
14.09%
1 janv. 1978
489.2 mln.
+58.64 mln.
13.62%
1 janv. 1979
566.4 mln.
+77.2 mln.
15.78%
1 janv. 1980
615.92 mln.
+49.52 mln.
8.74%
1 janv. 1981
589.44 mln.
-26.48 mln.
-4.3%
1 janv. 1982
586.44 mln.
-3.0 mln.
-0.51%
1 janv. 1983
563.475 mln.
-22.965 mln.
-3.92%
1 janv. 1984
581.809 mln.
+18.334 mln.
3.25%
1 janv. 1985
624.984 mln.
+43.175 mln.
7.42%
1 janv. 1986
677.847 mln.
+52.864 mln.
8.46%
1 janv. 1987
660.526 mln.
-17.321 mln.
-2.56%
1 janv. 1988
785.172 mln.
+124.646 mln.
18.87%
1 janv. 1989
832.209 mln.
+47.036 mln.
5.99%
1 janv. 1990
911.292 mln.
+79.083 mln.
9.5%
1 janv. 1991
1.042 mds
+131.208 mln.
14.4%
1 janv. 1992
1.173 mds
+130.8 mln.
12.55%
1 janv. 1993
1.419 mds
+245.5 mln.
20.92%
1 janv. 1994
1.557 mds
+138.5 mln.
9.76%
1 janv. 1995
1.772 mds
+214.4 mln.
13.77%
1 janv. 1996
2.026 mds
+254.7 mln.
14.38%
1 janv. 1997
2.17 mds
+143.2 mln.
7.07%
1 janv. 1998
2.339 mds
+169.7 mln.
7.82%
1 janv. 1999
2.568 mds
+229.2 mln.
9.8%
1 janv. 2000
2.815 mds
+246.9 mln.
9.61%
1 janv. 2001
3.031 mds
+215.3 mln.
7.65%
1 janv. 2002
3.191 mds
+160.4 mln.
5.29%
1 janv. 2003
3.308 mds
+116.8 mln.
3.66%
1 janv. 2004
3.391 mds
+83.1 mln.
2.51%
1 janv. 2005
3.496 mds
+104.8 mln.
3.09%
1 janv. 2006
3.648 mds
+152.3 mln.
4.36%
1 janv. 2007
3.789 mds
+141.2 mln.
3.87%
1 janv. 2008
4.026 mds
+236.7 mln.
6.25%
1 janv. 2009
4.234 mds
+207.5 mln.
5.15%
1 janv. 2010
3.925 mds
-308.7 mln.
-7.29%
1 janv. 2011
4.027 mds
+102.1 mln.
2.6%
1 janv. 2012
4.292 mds
+264.7 mln.
6.57%
1 janv. 2013
4.397 mds
+105.9 mln.
2.47%
1 janv. 2014
4.574 mds
+176.1 mln.
4.0%
1 janv. 2015
4.711 mds
+137.5 mln.
3.01%
1 janv. 2016
4.96 mds
+248.4 mln.
5.27%
Classement des pays selon les statistiques actuelles par années


Commentaires: