29
/fr/
fr
AIzaSyAYiBZKx7MnpbEhh9jyipgxe19OcubqV5w
April 1, 2024
103853
Chad
TCD
true
2
1
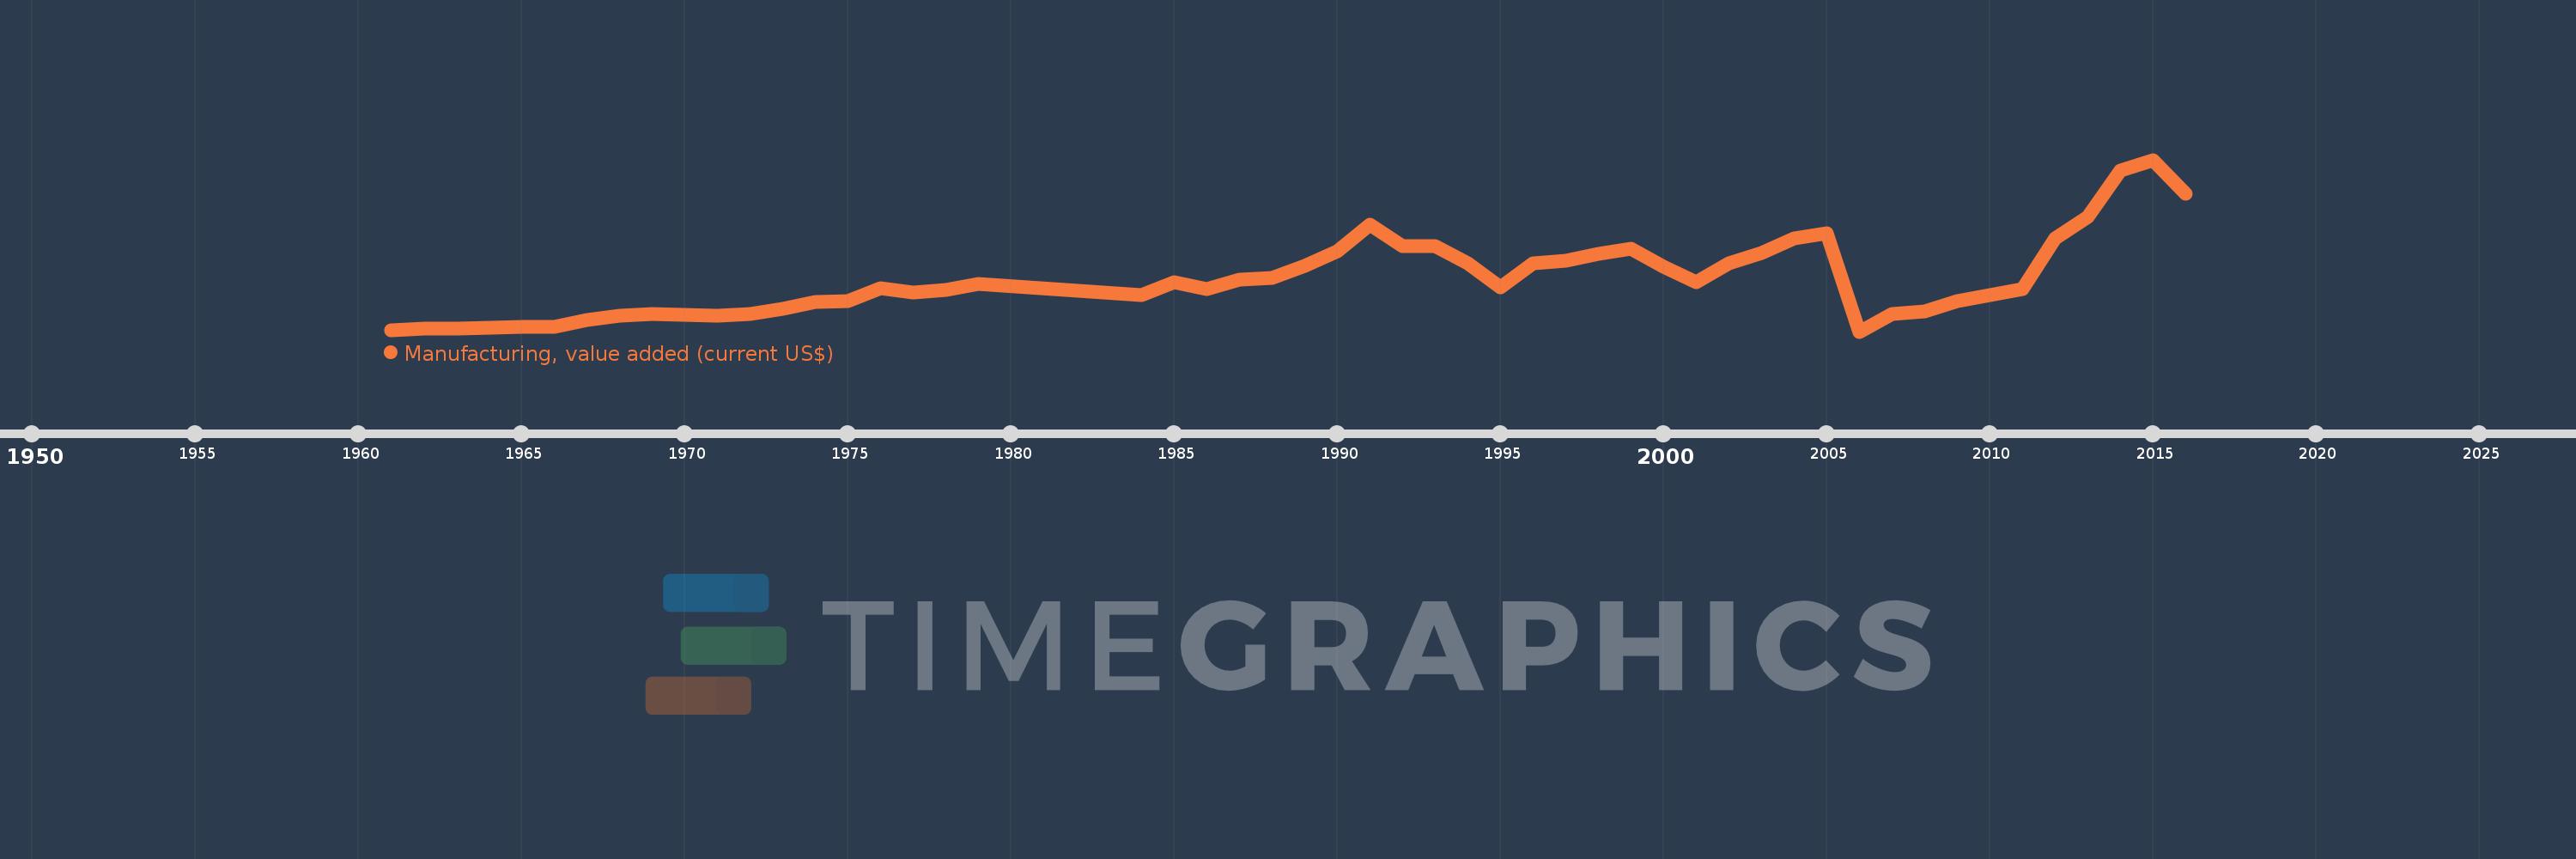
Manufacturing, value added (current US$)
2016,2015,2014,2013,2012,2011,2010,2009,2008,2007,2006,2005,2004,2003,2002,2001,2000,1999,1998,1997,1996,1995,1994,1993,1992,1991,1990,1989,1988,1987,1986,1985,1984,1979,1978,1977,1976,1975,1974,1973,1972,1971,1970,1969,1968,1967,1966,1965,1964,1963,1962,1961
Cette statistique dans les autres pays:
AfghanistanAlbaniaAlgeriaAndorraAngolaAntigua and BarbudaArab WorldArgentinaArmeniaArubaAustraliaAustriaAzerbaijanBahamas, TheBahrainBangladeshBarbadosBelarusBelgiumBelizeBeninBermudaBhutanBoliviaBosnia and HerzegovinaBotswanaBrazilBrunei DarussalamBurkina FasoBurundiCabo VerdeCambodiaCameroonCanadaCaribbean small statesCayman IslandsCentral African RepublicCentral Europe and the BalticsChadChileChinaColombiaComorosCongo, Dem. Rep.Congo, Rep.Costa RicaCote d'IvoireCroatiaCubaCyprusCzech RepublicDenmarkDjiboutiDominicaDominican RepublicEarly-demographic dividendEast Asia & PacificEast Asia & Pacific (excluding high income)East Asia & Pacific (IDA & IBRD countries)EcuadorEgypt, Arab Rep.El SalvadorEquatorial GuineaEritreaEstoniaEthiopiaEuro areaEurope & Central AsiaEurope & Central Asia (excluding high income)Europe & Central Asia (IDA & IBRD countries)European UnionFaroe IslandsFijiFinlandFragile and conflict affected situationsFranceGabonGambia, TheGeorgiaGermanyGhanaGreeceGrenadaGuatemalaGuineaGuinea-BissauGuyanaHeavily indebted poor countries (HIPC)High incomeHondurasHong Kong SAR, ChinaHungaryIBRD onlyIcelandIDA & IBRD totalIDA blendIDA onlyIDA totalIndiaIndonesiaIran, Islamic Rep.IraqIrelandItalyJamaicaJapanJordanKazakhstanKenyaKiribatiKorea, Rep.KosovoKuwaitKyrgyz RepublicLao PDRLate-demographic dividendLatin America & Caribbean Latin America & Caribbean (excluding high income)Latin America & the Caribbean (IDA & IBRD countries)LatviaLeast developed countries: UN classificationLebanonLesothoLiberiaLibyaLithuaniaLow & middle incomeLow incomeLower middle incomeLuxembourgMacao SAR, ChinaMacedonia, FYRMadagascarMalawiMalaysiaMaldivesMaliMaltaMarshall IslandsMauritaniaMauritiusMexicoMicronesia, Fed. Sts.Middle East & North AfricaMiddle East & North Africa (excluding high income)Middle East & North Africa (IDA & IBRD countries)Middle incomeMoldovaMongoliaMontenegroMoroccoMozambiqueMyanmarNamibiaNepalNetherlandsNew CaledoniaNew ZealandNicaraguaNigerNigeriaNorth AmericaNorwayOECD membersOmanOther small statesPacific island small statesPakistanPalauPanamaPapua New GuineaParaguayPeruPhilippinesPolandPortugalPost-demographic dividendPre-demographic dividendPuerto RicoQatarRomaniaRussian FederationRwandaSamoaSao Tome and PrincipeSaudi ArabiaSenegalSerbiaSeychellesSierra LeoneSingaporeSlovak RepublicSloveniaSmall statesSolomon IslandsSouth AfricaSouth AsiaSouth Asia (IDA & IBRD)SpainSri LankaSt. Kitts and NevisSt. LuciaSt. Vincent and the GrenadinesSub-Saharan Africa Sub-Saharan Africa (excluding high income)Sub-Saharan Africa (IDA & IBRD countries)SudanSurinameSwazilandSwedenSwitzerlandSyrian Arab RepublicTajikistanTanzaniaThailandTimor-LesteTogoTongaTrinidad and TobagoTunisiaTurkeyTurkmenistanTuvaluUgandaUkraineUnited Arab EmiratesUnited KingdomUnited StatesUpper middle incomeUruguayUzbekistanVanuatuVenezuela, RBVietnamWest Bank and GazaWorldYemen, Rep.ZambiaZimbabwe La ligne de temps
Cette échelle de temps montre un graphique de 1961 année à 2016 année Chad. Les données jusqu'à 1960 année ne sont pas présentés. Quantité d'observations actuelles selon dates: 52.
Source (désignation):
Les indicateurs du développement mondiale
Source (organisation):
World Bank national accounts data, and OECD National Accounts data files.
Catégories:
Economy & Growth
Dernière mise à jour
23 avr. 2017
Les indicateurs de changement de valeurs selon les années
Minimum:
15.461 mln.
1 janv. 2006
Maximum:
374.228 mln.
1 janv. 2015
Pour la date d''observation
Valeur
Changement absolu
Le changement par rapport à la valeur précédente
1 janv. 1961
18.997 mln.
+18.997 mln.
0.0%
1 janv. 1962
21.991 mln.
+2.994 mln.
15.76%
1 janv. 1963
21.015 mln.
-976.002 milles
-4.44%
1 janv. 1964
23.014 mln.
+2.0 mln.
9.52%
1 janv. 1965
26.015 mln.
+3.001 mln.
13.04%
1 janv. 1966
25.247 mln.
-768.553 milles
-2.95%
1 janv. 1967
38.918 mln.
+13.671 mln.
54.15%
1 janv. 1968
47.837 mln.
+8.919 mln.
22.92%
1 janv. 1969
52.485 mln.
+4.648 mln.
9.72%
1 janv. 1970
49.982 mln.
-2.503 mln.
-4.77%
1 janv. 1971
48.786 mln.
-1.197 mln.
-2.39%
1 janv. 1972
52.527 mln.
+3.741 mln.
7.67%
1 janv. 1973
62.252 mln.
+9.725 mln.
18.51%
1 janv. 1974
78.092 mln.
+15.84 mln.
25.44%
1 janv. 1975
79.44 mln.
+1.348 mln.
1.73%
1 janv. 1976
105.237 mln.
+25.798 mln.
32.47%
1 janv. 1977
96.437 mln.
-8.8 mln.
-8.36%
1 janv. 1978
101.779 mln.
+5.341 mln.
5.54%
1 janv. 1979
115.579 mln.
+13.801 mln.
13.56%
1 janv. 1984
91.813 mln.
-23.766 mln.
-20.56%
1 janv. 1985
118.342 mln.
+26.529 mln.
28.89%
1 janv. 1986
104.925 mln.
-13.417 mln.
-11.34%
1 janv. 1987
123.392 mln.
+18.467 mln.
17.6%
1 janv. 1988
127.452 mln.
+4.059 mln.
3.29%
1 janv. 1989
152.055 mln.
+24.603 mln.
19.3%
1 janv. 1990
182.804 mln.
+30.749 mln.
20.22%
1 janv. 1991
238.555 mln.
+55.751 mln.
30.5%
1 janv. 1992
193.733 mln.
-44.822 mln.
-18.79%
1 janv. 1993
193.405 mln.
-328.381 milles
-0.17%
1 janv. 1994
157.73 mln.
-35.675 mln.
-18.45%
1 janv. 1995
106.988 mln.
-50.742 mln.
-32.17%
1 janv. 1996
158.871 mln.
+51.883 mln.
48.49%
1 janv. 1997
162.816 mln.
+3.945 mln.
2.48%
1 janv. 1998
178.313 mln.
+15.497 mln.
9.52%
1 janv. 1999
188.058 mln.
+9.745 mln.
5.47%
1 janv. 2000
150.103 mln.
-37.956 mln.
-20.18%
1 janv. 2001
118.95 mln.
-31.153 mln.
-20.75%
1 janv. 2002
157.456 mln.
+38.506 mln.
32.37%
1 janv. 2003
180.122 mln.
+22.666 mln.
14.4%
1 janv. 2004
209.94 mln.
+29.818 mln.
16.55%
1 janv. 2005
221.661 mln.
+11.721 mln.
5.58%
1 janv. 2006
15.461 mln.
-206.2 mln.
-93.03%
1 janv. 2007
51.646 mln.
+36.185 mln.
234.05%
1 janv. 2008
58.35 mln.
+6.704 mln.
12.98%
1 janv. 2009
79.47 mln.
+21.12 mln.
36.2%
1 janv. 2010
92.2 mln.
+12.731 mln.
16.02%
1 janv. 2011
103.673 mln.
+11.472 mln.
12.44%
1 janv. 2012
209.867 mln.
+106.195 mln.
102.43%
1 janv. 2013
254.639 mln.
+44.771 mln.
21.33%
1 janv. 2014
352.267 mln.
+97.629 mln.
38.34%
1 janv. 2015
374.228 mln.
+21.961 mln.
6.23%
1 janv. 2016
304.111 mln.
-70.117 mln.
-18.74%
Classement des pays selon les statistiques actuelles par années


Commentaires: