29
/fr/
fr
AIzaSyAYiBZKx7MnpbEhh9jyipgxe19OcubqV5w
April 1, 2024
267274
Trinidad and Tobago
TTO
true
2
1
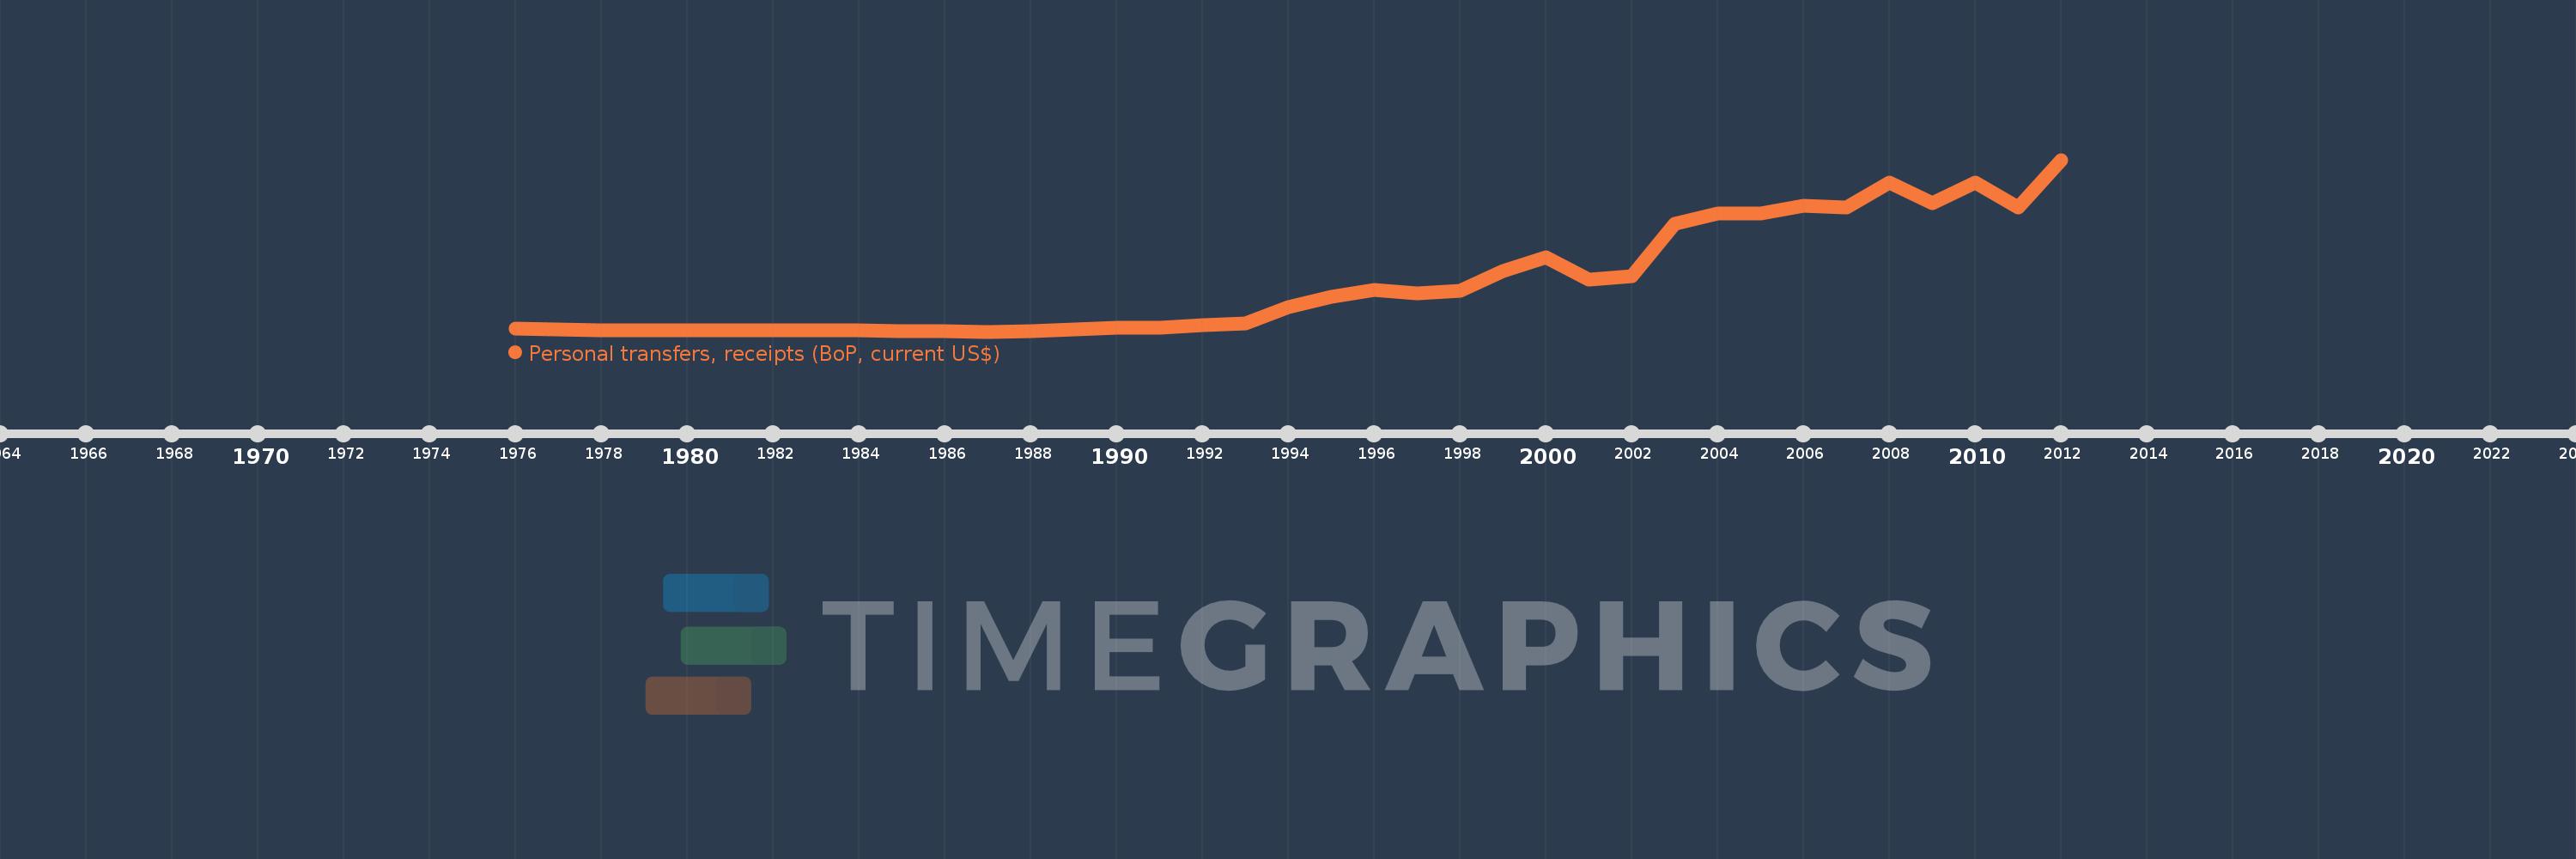
Personal transfers, receipts (BoP, current US$)
2012,2011,2010,2009,2008,2007,2006,2005,2004,2003,2002,2001,2000,1999,1998,1997,1996,1995,1994,1993,1992,1991,1990,1989,1988,1987,1986,1985,1984,1983,1982,1981,1980,1979,1978,1977,1976
Cette statistique dans les autres pays:
La ligne de temps
Cette échelle de temps montre un graphique de 1976 année à 2012 année Trinidad and Tobago. Les données jusqu'à 1975 année ne sont pas présentés. Quantité d'observations actuelles selon dates: 37.
Source (désignation):
Les indicateurs du développement mondiale
Source (organisation):
International Monetary Fund, Balance of Payments Statistics Yearbook and data files.
Catégories:
Economy & Growth, Financial Sector
Dernière mise à jour
23 avr. 2017
Les indicateurs de changement de valeurs selon les années
Minimum:
166.667 milles
1 janv. 1987
Maximum:
126.068 mln.
1 janv. 2012
Pour la date d''observation
Valeur
Changement absolu
Le changement par rapport à la valeur précédente
1 janv. 1976
2.627 mln.
+2.627 mln.
0.0%
1 janv. 1977
1.642 mln.
-984.793 milles
-37.49%
1 janv. 1978
1.417 mln.
-225.513 milles
-13.73%
1 janv. 1979
1.417 mln.
0.0
0.0%
1 janv. 1980
1.417 mln.
0.0
0.0%
1 janv. 1981
1.417 mln.
0.0
0.0%
1 janv. 1982
1.417 mln.
0.0
0.0%
1 janv. 1983
1.375 mln.
-41.667 milles
-2.94%
1 janv. 1984
1.375 mln.
0.0
0.0%
1 janv. 1985
250.0 milles
-1.125 mln.
-81.82%
1 janv. 1986
204.082 milles
-45.918 milles
-18.37%
1 janv. 1987
166.667 milles
-37.415 milles
-18.33%
1 janv. 1988
277.778 milles
+111.111 milles
66.67%
1 janv. 1989
1.717 mln.
+1.439 mln.
518.15%
1 janv. 1990
2.871 mln.
+1.154 mln.
67.18%
1 janv. 1991
2.988 mln.
+117.647 milles
4.1%
1 janv. 1992
4.8 mln.
+1.812 mln.
60.63%
1 janv. 1993
6.188 mln.
+1.388 mln.
28.92%
1 janv. 1994
18.258 mln.
+12.07 mln.
195.04%
1 janv. 1995
25.671 mln.
+7.413 mln.
40.6%
1 janv. 1996
30.398 mln.
+4.727 mln.
18.41%
1 janv. 1997
28.126 mln.
-2.272 mln.
-7.47%
1 janv. 1998
30.2 mln.
+2.074 mln.
7.37%
1 janv. 1999
44.568 mln.
+14.368 mln.
47.58%
1 janv. 2000
54.4 mln.
+9.832 mln.
22.06%
1 janv. 2001
38.1 mln.
-16.3 mln.
-29.96%
1 janv. 2002
40.9 mln.
+2.8 mln.
7.35%
1 janv. 2003
79.1 mln.
+38.2 mln.
93.4%
1 janv. 2004
86.8 mln.
+7.7 mln.
9.73%
1 janv. 2005
86.9 mln.
+100.0 milles
0.12%
1 janv. 2006
92.4 mln.
+5.5 mln.
6.33%
1 janv. 2007
91.2 mln.
-1.2 mln.
-1.3%
1 janv. 2008
109.4 mln.
+18.2 mln.
19.96%
1 janv. 2009
94.5 mln.
-14.9 mln.
-13.62%
1 janv. 2010
109.3 mln.
+14.8 mln.
15.66%
1 janv. 2011
90.9 mln.
-18.4 mln.
-16.83%
1 janv. 2012
126.068 mln.
+35.168 mln.
38.69%
Classement des pays selon les statistiques actuelles par années


Commentaires: