29
/fr/
fr
AIzaSyAYiBZKx7MnpbEhh9jyipgxe19OcubqV5w
April 1, 2024
167977
Kenya
KEN
true
2
1
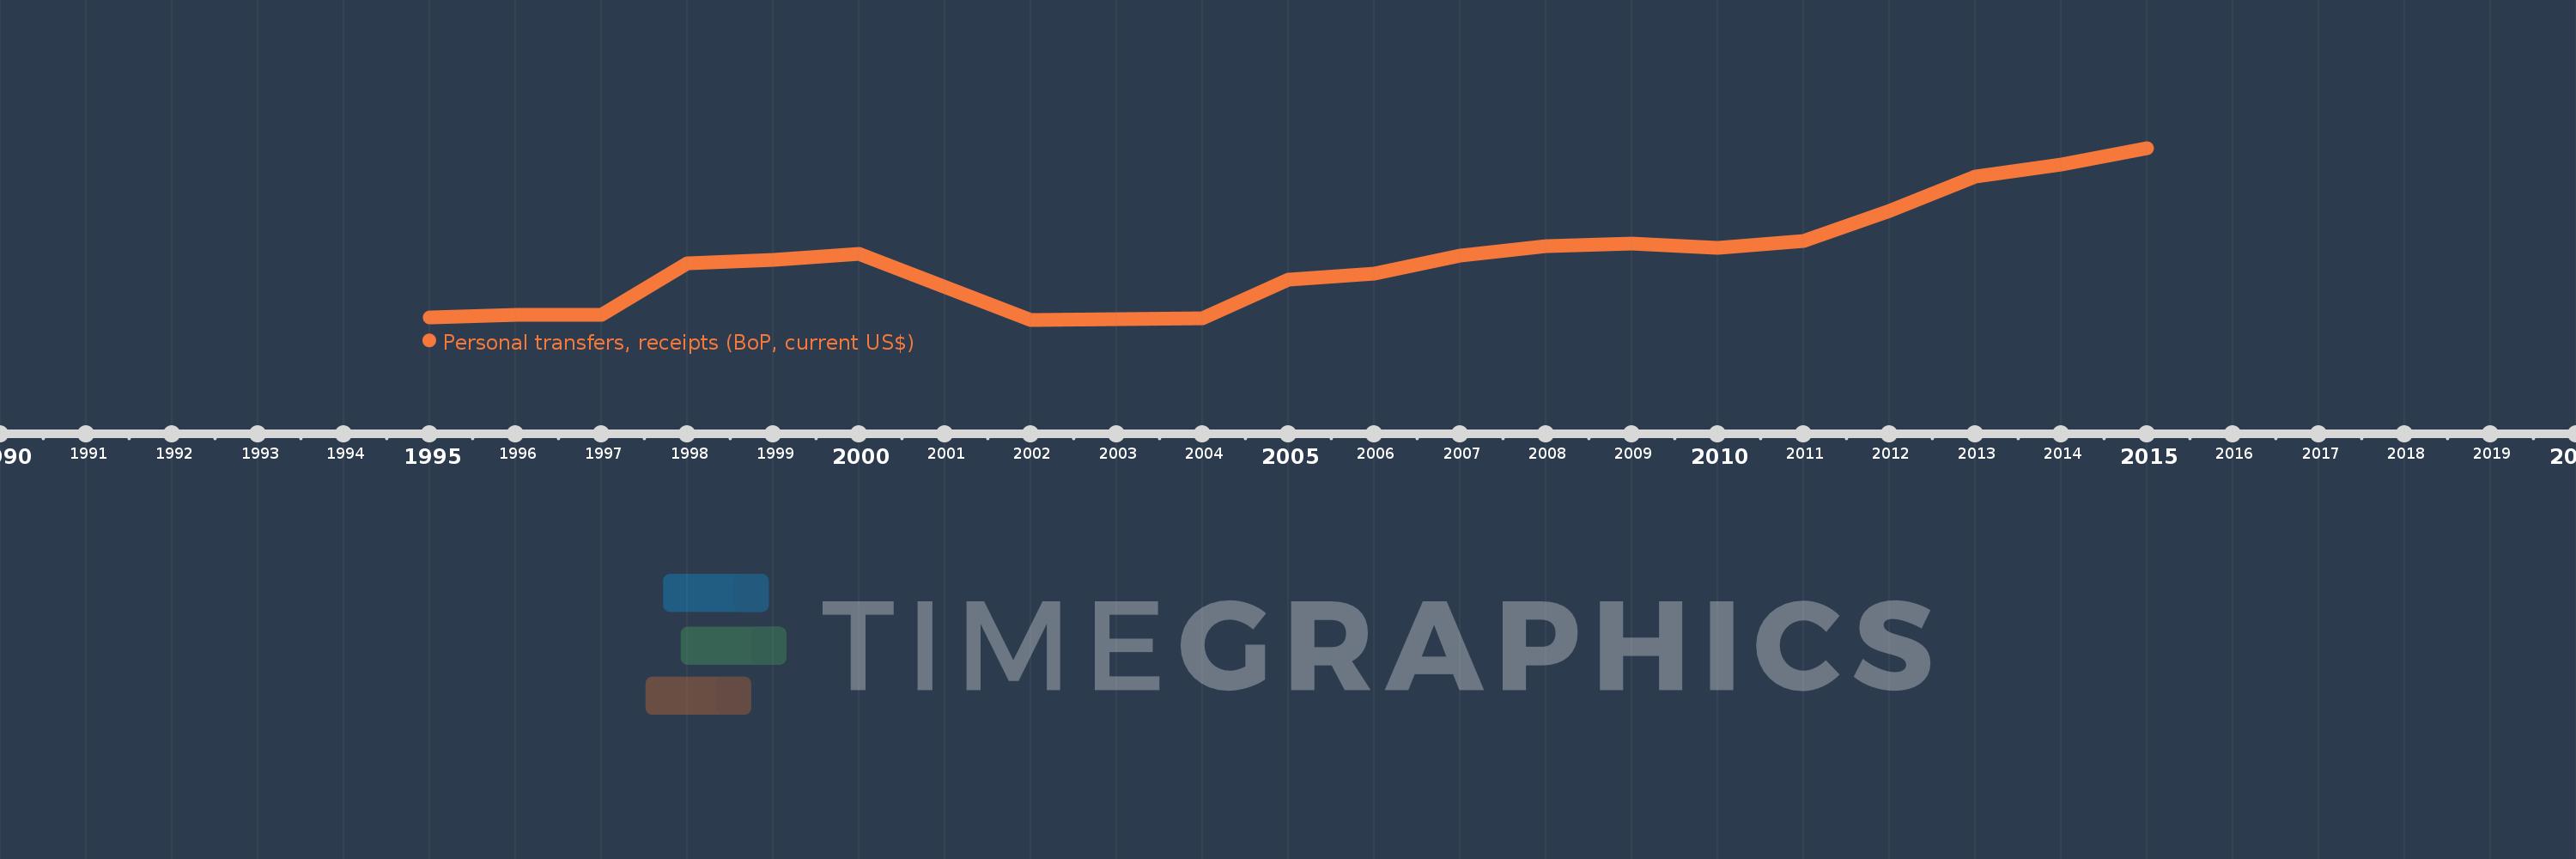
Personal transfers, receipts (BoP, current US$)
2015,2014,2013,2012,2011,2010,2009,2008,2007,2006,2005,2004,2003,2002,2000,1999,1998,1997,1996,1995
Cette statistique dans les autres pays:
La ligne de temps
Cette échelle de temps montre un graphique de 1995 année à 2015 année Kenya. Les données jusqu'à 1994 année ne sont pas présentés. Quantité d'observations actuelles selon dates: 20.
Source (désignation):
Les indicateurs du développement mondiale
Source (organisation):
International Monetary Fund, Balance of Payments Statistics Yearbook and data files.
Catégories:
Economy & Growth, Financial Sector
Dernière mise à jour
23 avr. 2017
Les indicateurs de changement de valeurs selon les années
Minimum:
50.914 mln.
1 janv. 2002
Maximum:
1.441 mds
1 janv. 2015
Pour la date d''observation
Valeur
Changement absolu
Le changement par rapport à la valeur précédente
1 janv. 1995
71.364 mln.
+71.364 mln.
0.0%
1 janv. 1996
87.498 mln.
+16.134 mln.
22.61%
1 janv. 1997
87.543 mln.
+45.028 milles
0.05%
1 janv. 1998
506.615 mln.
+419.072 mln.
478.71%
1 janv. 1999
531.913 mln.
+25.298 mln.
4.99%
1 janv. 2000
584.854 mln.
+52.942 mln.
9.95%
1 janv. 2002
50.914 mln.
-533.94 mln.
-91.29%
1 janv. 2003
57.143 mln.
+6.229 mln.
12.23%
1 janv. 2004
65.845 mln.
+8.702 mln.
15.23%
1 janv. 2005
375.811 mln.
+309.966 mln.
470.75%
1 janv. 2006
424.991 mln.
+49.18 mln.
13.09%
1 janv. 2007
570.459 mln.
+145.468 mln.
34.23%
1 janv. 2008
645.208 mln.
+74.749 mln.
13.1%
1 janv. 2009
667.317 mln.
+22.109 mln.
3.43%
1 janv. 2010
631.461 mln.
-35.856 mln.
-5.37%
1 janv. 2011
685.757 mln.
+54.296 mln.
8.6%
1 janv. 2012
934.149 mln.
+248.392 mln.
36.22%
1 janv. 2013
1.211 mds
+276.872 mln.
29.64%
1 janv. 2014
1.304 mds
+93.256 mln.
7.7%
1 janv. 2015
1.441 mds
+136.569 mln.
10.47%
Classement des pays selon les statistiques actuelles par années


Commentaires: