29
/fr/
fr
AIzaSyAYiBZKx7MnpbEhh9jyipgxe19OcubqV5w
April 1, 2024
204521
Myanmar
MMR
true
2
1
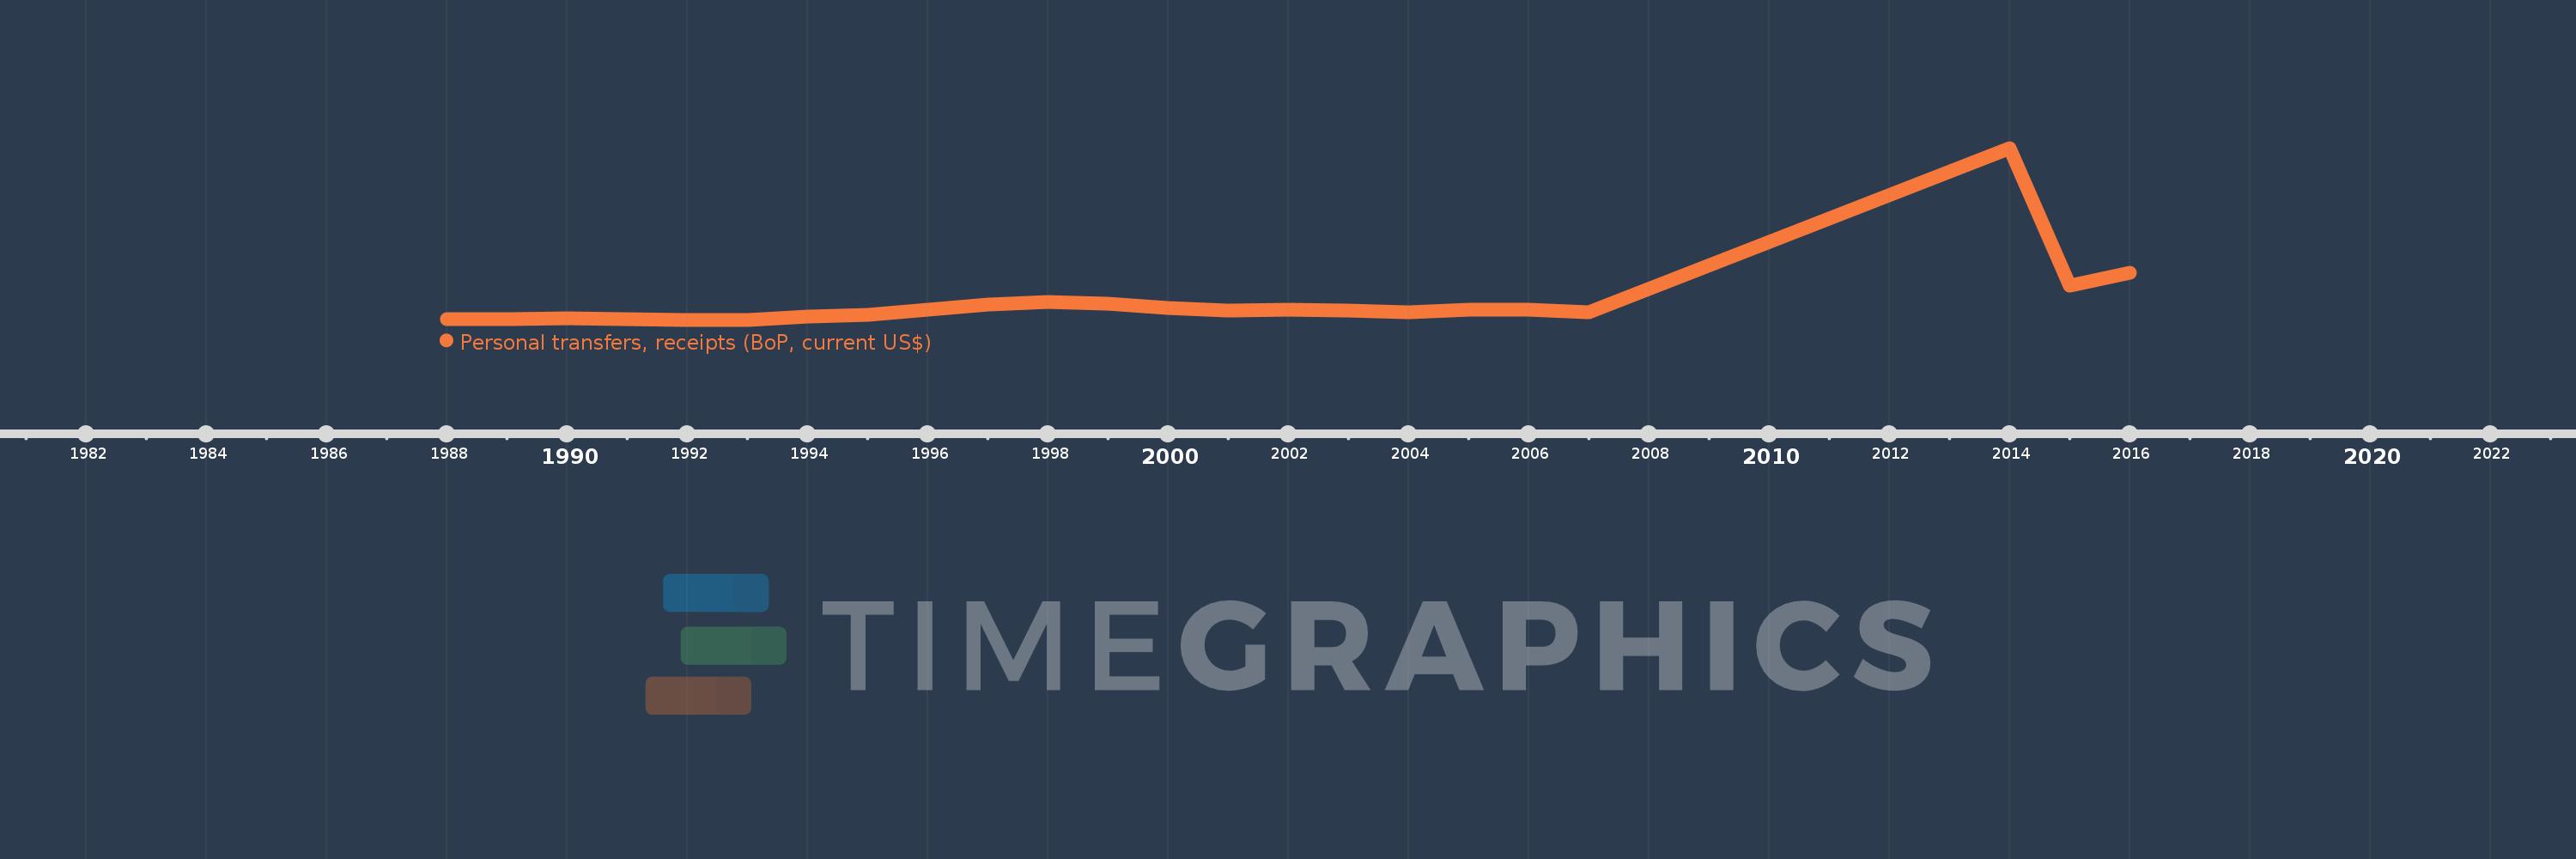
Personal transfers, receipts (BoP, current US$)
2016,2015,2014,2007,2006,2005,2004,2003,2002,2001,2000,1999,1998,1997,1996,1995,1994,1993,1992,1991,1990,1989,1988
Cette statistique dans les autres pays:
La ligne de temps
Cette échelle de temps montre un graphique de 1988 année à 2016 année Myanmar. Les données jusqu'à 1987 année ne sont pas présentés. Quantité d'observations actuelles selon dates: 23.
Source (désignation):
Les indicateurs du développement mondiale
Source (organisation):
International Monetary Fund, Balance of Payments Statistics Yearbook and data files.
Catégories:
Economy & Growth, Financial Sector
Dernière mise à jour
23 avr. 2017
Les indicateurs de changement de valeurs selon les années
Minimum:
276.967 milles
1 janv. 1993
Maximum:
1.414 mds
1 janv. 2014
Pour la date d''observation
Valeur
Changement absolu
Le changement par rapport à la valeur précédente
1 janv. 1988
5.909 mln.
+5.909 mln.
0.0%
1 janv. 1989
6.772 mln.
+863.012 milles
14.61%
1 janv. 1990
9.186 mln.
+2.414 mln.
35.65%
1 janv. 1991
5.911 mln.
-3.275 mln.
-35.65%
1 janv. 1992
1.537 mln.
-4.374 mln.
-74.0%
1 janv. 1993
276.967 milles
-1.26 mln.
-81.98%
1 janv. 1994
28.246 mln.
+27.969 mln.
10.1 milles%
1 janv. 1995
41.564 mln.
+13.318 mln.
47.15%
1 janv. 1996
80.575 mln.
+39.011 mln.
93.86%
1 janv. 1997
122.45 mln.
+41.875 mln.
51.97%
1 janv. 1998
147.206 mln.
+24.755 mln.
20.22%
1 janv. 1999
135.823 mln.
-11.383 mln.
-7.73%
1 janv. 2000
96.4 mln.
-39.423 mln.
-29.03%
1 janv. 2001
75.609 mln.
-20.791 mln.
-21.57%
1 janv. 2002
85.626 mln.
+10.016 mln.
13.25%
1 janv. 2003
75.324 mln.
-10.301 mln.
-12.03%
1 janv. 2004
58.647 mln.
-16.678 mln.
-22.14%
1 janv. 2005
80.477 mln.
+21.831 mln.
37.22%
1 janv. 2006
86.178 mln.
+5.701 mln.
7.08%
1 janv. 2007
65.043 mln.
-21.135 mln.
-24.52%
1 janv. 2014
1.414 mds
+1.349 mds
2.07 milles%
1 janv. 2015
278.964 mln.
-1.135 mds
-80.28%
1 janv. 2016
386.784 mln.
+107.82 mln.
38.65%
Classement des pays selon les statistiques actuelles par années


Commentaires: