29
/fr/
fr
AIzaSyAYiBZKx7MnpbEhh9jyipgxe19OcubqV5w
April 1, 2024
246113
South Africa
ZAF
true
2
1
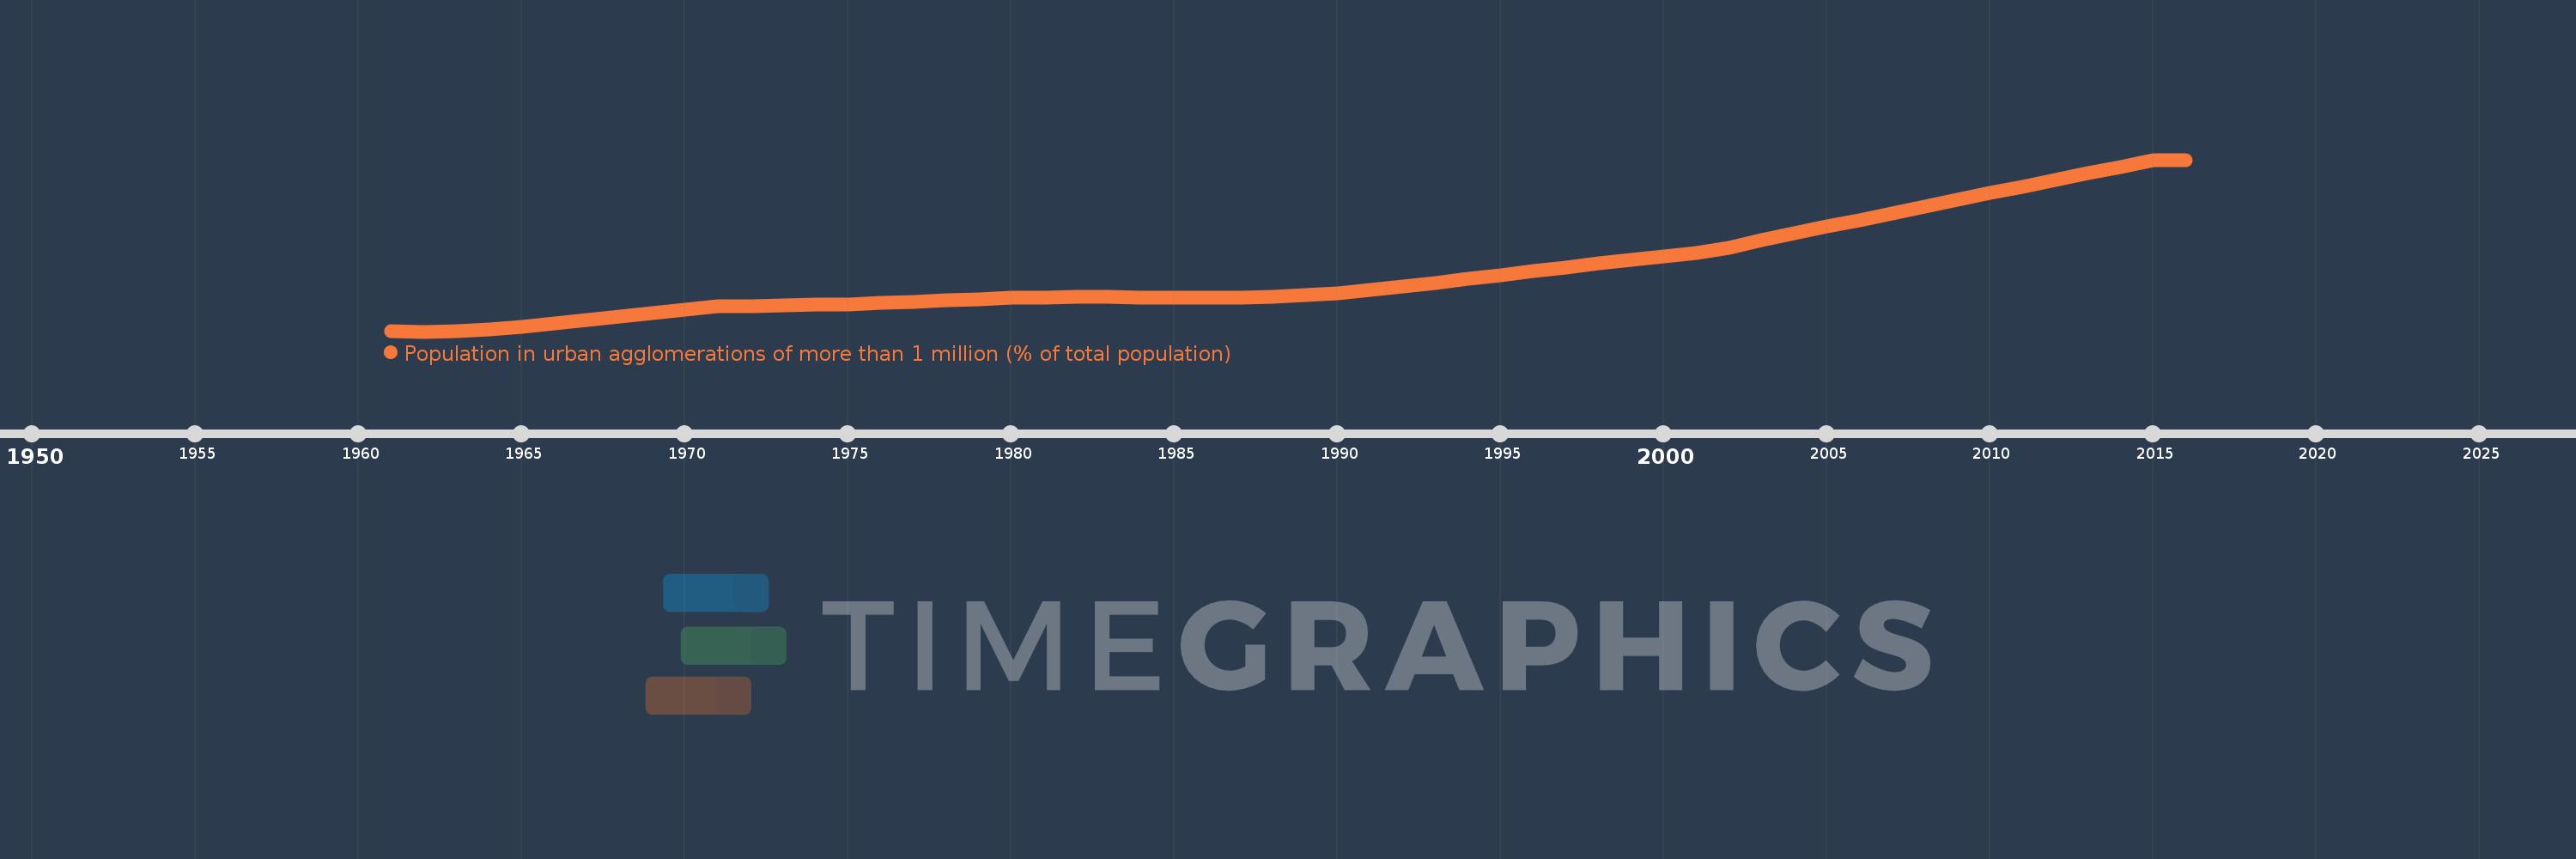
Population in urban agglomerations of more than 1 million (% of total population)
2016,2015,2014,2013,2012,2011,2010,2009,2008,2007,2006,2005,2004,2003,2002,2001,2000,1999,1998,1997,1996,1995,1994,1993,1992,1991,1990,1989,1988,1987,1986,1985,1984,1983,1982,1981,1980,1979,1978,1977,1976,1975,1974,1973,1972,1971,1970,1969,1968,1967,1966,1965,1964,1963,1962,1961
Cette statistique dans les autres pays:
La ligne de temps
Cette échelle de temps montre un graphique de 1961 année à 2016 année South Africa. Les données jusqu'à 1960 année ne sont pas présentés. Quantité d'observations actuelles selon dates: 56.
Source (désignation):
Les indicateurs du développement mondiale
Source (organisation):
United Nations, World Urbanization Prospects.
Catégories:
Climate Change, Urban Development
Dernière mise à jour
23 avr. 2017
Les indicateurs de changement de valeurs selon les années
Minimum:
25.897
1 janv. 1962
Maximum:
37.034
1 janv. 2016
Pour la date d''observation
Valeur
Changement absolu
Le changement par rapport à la valeur précédente
1 janv. 1961
25.939
+25.939
0.0%
1 janv. 1962
25.897
-0.042
-0.16%
1 janv. 1963
25.942
+0.045
0.17%
1 janv. 1964
26.054
+0.112
0.43%
1 janv. 1965
26.215
+0.161
0.62%
1 janv. 1966
26.409
+0.194
0.74%
1 janv. 1967
26.626
+0.218
0.82%
1 janv. 1968
26.857
+0.231
0.87%
1 janv. 1969
27.095
+0.238
0.89%
1 janv. 1970
27.332
+0.236
0.87%
1 janv. 1971
27.538
+0.207
0.76%
1 janv. 1972
27.559
+0.021
0.08%
1 janv. 1973
27.588
+0.029
0.11%
1 janv. 1974
27.626
+0.037
0.14%
1 janv. 1975
27.676
+0.05
0.18%
1 janv. 1976
27.738
+0.062
0.22%
1 janv. 1977
27.815
+0.077
0.28%
1 janv. 1978
27.908
+0.094
0.34%
1 janv. 1979
28.005
+0.097
0.35%
1 janv. 1980
28.08
+0.075
0.27%
1 janv. 1981
28.121
+0.041
0.15%
1 janv. 1982
28.135
+0.014
0.05%
1 janv. 1983
28.132
-0.003
-0.01%
1 janv. 1984
28.116
-0.016
-0.06%
1 janv. 1985
28.095
-0.021
-0.08%
1 janv. 1986
28.086
-0.009
-0.03%
1 janv. 1987
28.116
+0.031
0.11%
1 janv. 1988
28.171
+0.055
0.2%
1 janv. 1989
28.263
+0.092
0.33%
1 janv. 1990
28.402
+0.138
0.49%
1 janv. 1991
28.604
+0.202
0.71%
1 janv. 1992
28.82
+0.216
0.76%
1 janv. 1993
29.069
+0.25
0.87%
1 janv. 1994
29.318
+0.248
0.85%
1 janv. 1995
29.568
+0.25
0.85%
1 janv. 1996
29.819
+0.251
0.85%
1 janv. 1997
30.061
+0.242
0.81%
1 janv. 1998
30.305
+0.244
0.81%
1 janv. 1999
30.542
+0.237
0.78%
1 janv. 2000
30.765
+0.223
0.73%
1 janv. 2001
30.974
+0.21
0.68%
1 janv. 2002
31.321
+0.346
1.12%
1 janv. 2003
31.822
+0.502
1.6%
1 janv. 2004
32.258
+0.436
1.37%
1 janv. 2005
32.696
+0.437
1.36%
1 janv. 2006
33.13
+0.434
1.33%
1 janv. 2007
33.565
+0.435
1.31%
1 janv. 2008
33.999
+0.434
1.29%
1 janv. 2009
34.434
+0.434
1.28%
1 janv. 2010
34.864
+0.43
1.25%
1 janv. 2011
35.294
+0.43
1.23%
1 janv. 2012
35.722
+0.428
1.21%
1 janv. 2013
36.15
+0.427
1.2%
1 janv. 2014
36.574
+0.425
1.17%
1 janv. 2015
36.996
+0.422
1.15%
1 janv. 2016
37.034
+0.038
0.1%
Classement des pays selon les statistiques actuelles par années


Commentaires: