29
/fr/
fr
AIzaSyAYiBZKx7MnpbEhh9jyipgxe19OcubqV5w
April 1, 2024
112769
Costa Rica
CRI
true
2
1
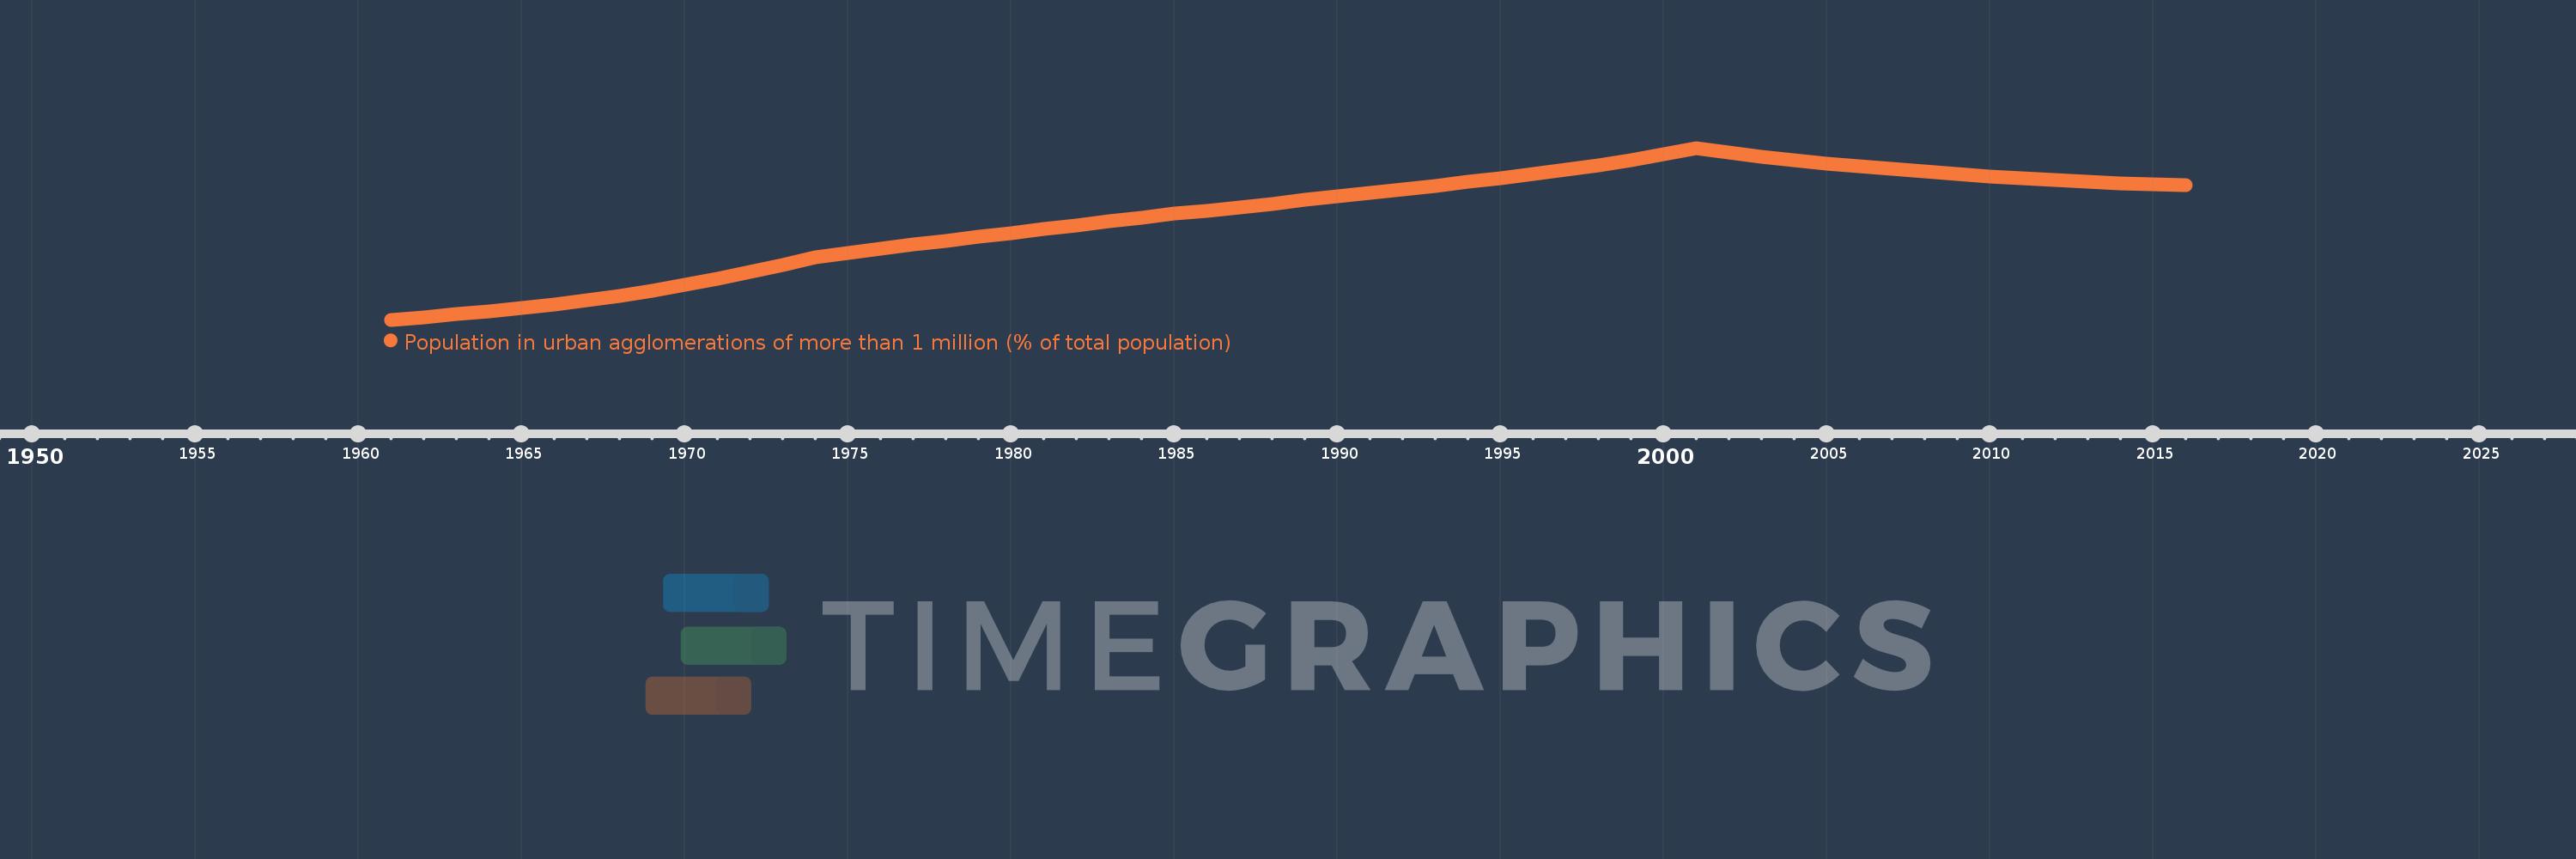
Population in urban agglomerations of more than 1 million (% of total population)
2016,2015,2014,2013,2012,2011,2010,2009,2008,2007,2006,2005,2004,2003,2002,2001,2000,1999,1998,1997,1996,1995,1994,1993,1992,1991,1990,1989,1988,1987,1986,1985,1984,1983,1982,1981,1980,1979,1978,1977,1976,1975,1974,1973,1972,1971,1970,1969,1968,1967,1966,1965,1964,1963,1962,1961
Cette statistique dans les autres pays:
La ligne de temps
Cette échelle de temps montre un graphique de 1961 année à 2016 année Costa Rica. Les données jusqu'à 1960 année ne sont pas présentés. Quantité d'observations actuelles selon dates: 56.
Source (désignation):
Les indicateurs du développement mondiale
Source (organisation):
United Nations, World Urbanization Prospects.
Catégories:
Climate Change, Urban Development
Dernière mise à jour
23 avr. 2017
Les indicateurs de changement de valeurs selon les années
Minimum:
17.238
1 janv. 1961
Maximum:
26.288
1 janv. 2001
Pour la date d''observation
Valeur
Changement absolu
Le changement par rapport à la valeur précédente
1 janv. 1961
17.238
+17.238
0.0%
1 janv. 1962
17.378
+0.14
0.81%
1 janv. 1963
17.521
+0.143
0.82%
1 janv. 1964
17.673
+0.153
0.87%
1 janv. 1965
17.849
+0.176
0.99%
1 janv. 1966
18.045
+0.196
1.1%
1 janv. 1967
18.264
+0.219
1.21%
1 janv. 1968
18.505
+0.241
1.32%
1 janv. 1969
18.773
+0.268
1.45%
1 janv. 1970
19.066
+0.294
1.56%
1 janv. 1971
19.391
+0.324
1.7%
1 janv. 1972
19.747
+0.356
1.84%
1 janv. 1973
20.132
+0.386
1.95%
1 janv. 1974
20.512
+0.38
1.89%
1 janv. 1975
20.742
+0.23
1.12%
1 janv. 1976
20.967
+0.225
1.08%
1 janv. 1977
21.186
+0.219
1.05%
1 janv. 1978
21.398
+0.212
1.0%
1 janv. 1979
21.607
+0.208
0.97%
1 janv. 1980
21.812
+0.205
0.95%
1 janv. 1981
22.016
+0.204
0.94%
1 janv. 1982
22.215
+0.199
0.9%
1 janv. 1983
22.412
+0.198
0.89%
1 janv. 1984
22.613
+0.2
0.89%
1 janv. 1985
22.819
+0.207
0.91%
1 janv. 1986
22.98
+0.16
0.7%
1 janv. 1987
23.155
+0.175
0.76%
1 janv. 1988
23.343
+0.188
0.81%
1 janv. 1989
23.539
+0.196
0.84%
1 janv. 1990
23.733
+0.194
0.82%
1 janv. 1991
23.923
+0.19
0.8%
1 janv. 1992
24.11
+0.187
0.78%
1 janv. 1993
24.299
+0.189
0.78%
1 janv. 1994
24.49
+0.191
0.79%
1 janv. 1995
24.691
+0.201
0.82%
1 janv. 1996
24.905
+0.214
0.87%
1 janv. 1997
25.132
+0.227
0.91%
1 janv. 1998
25.373
+0.24
0.96%
1 janv. 1999
25.64
+0.267
1.05%
1 janv. 2000
25.945
+0.305
1.19%
1 janv. 2001
26.288
+0.344
1.32%
1 janv. 2002
26.035
-0.254
-0.97%
1 janv. 2003
25.823
-0.211
-0.81%
1 janv. 2004
25.643
-0.18
-0.7%
1 janv. 2005
25.481
-0.162
-0.63%
1 janv. 2006
25.326
-0.155
-0.61%
1 janv. 2007
25.176
-0.149
-0.59%
1 janv. 2008
25.034
-0.142
-0.56%
1 janv. 2009
24.902
-0.133
-0.53%
1 janv. 2010
24.781
-0.121
-0.49%
1 janv. 2011
24.675
-0.106
-0.43%
1 janv. 2012
24.582
-0.092
-0.37%
1 janv. 2013
24.502
-0.08
-0.33%
1 janv. 2014
24.432
-0.07
-0.28%
1 janv. 2015
24.372
-0.061
-0.25%
1 janv. 2016
24.339
-0.032
-0.13%
Classement des pays selon les statistiques actuelles par années


Commentaires: