29
/fr/
fr
AIzaSyAYiBZKx7MnpbEhh9jyipgxe19OcubqV5w
April 1, 2024
126704
El Salvador
SLV
true
2
1
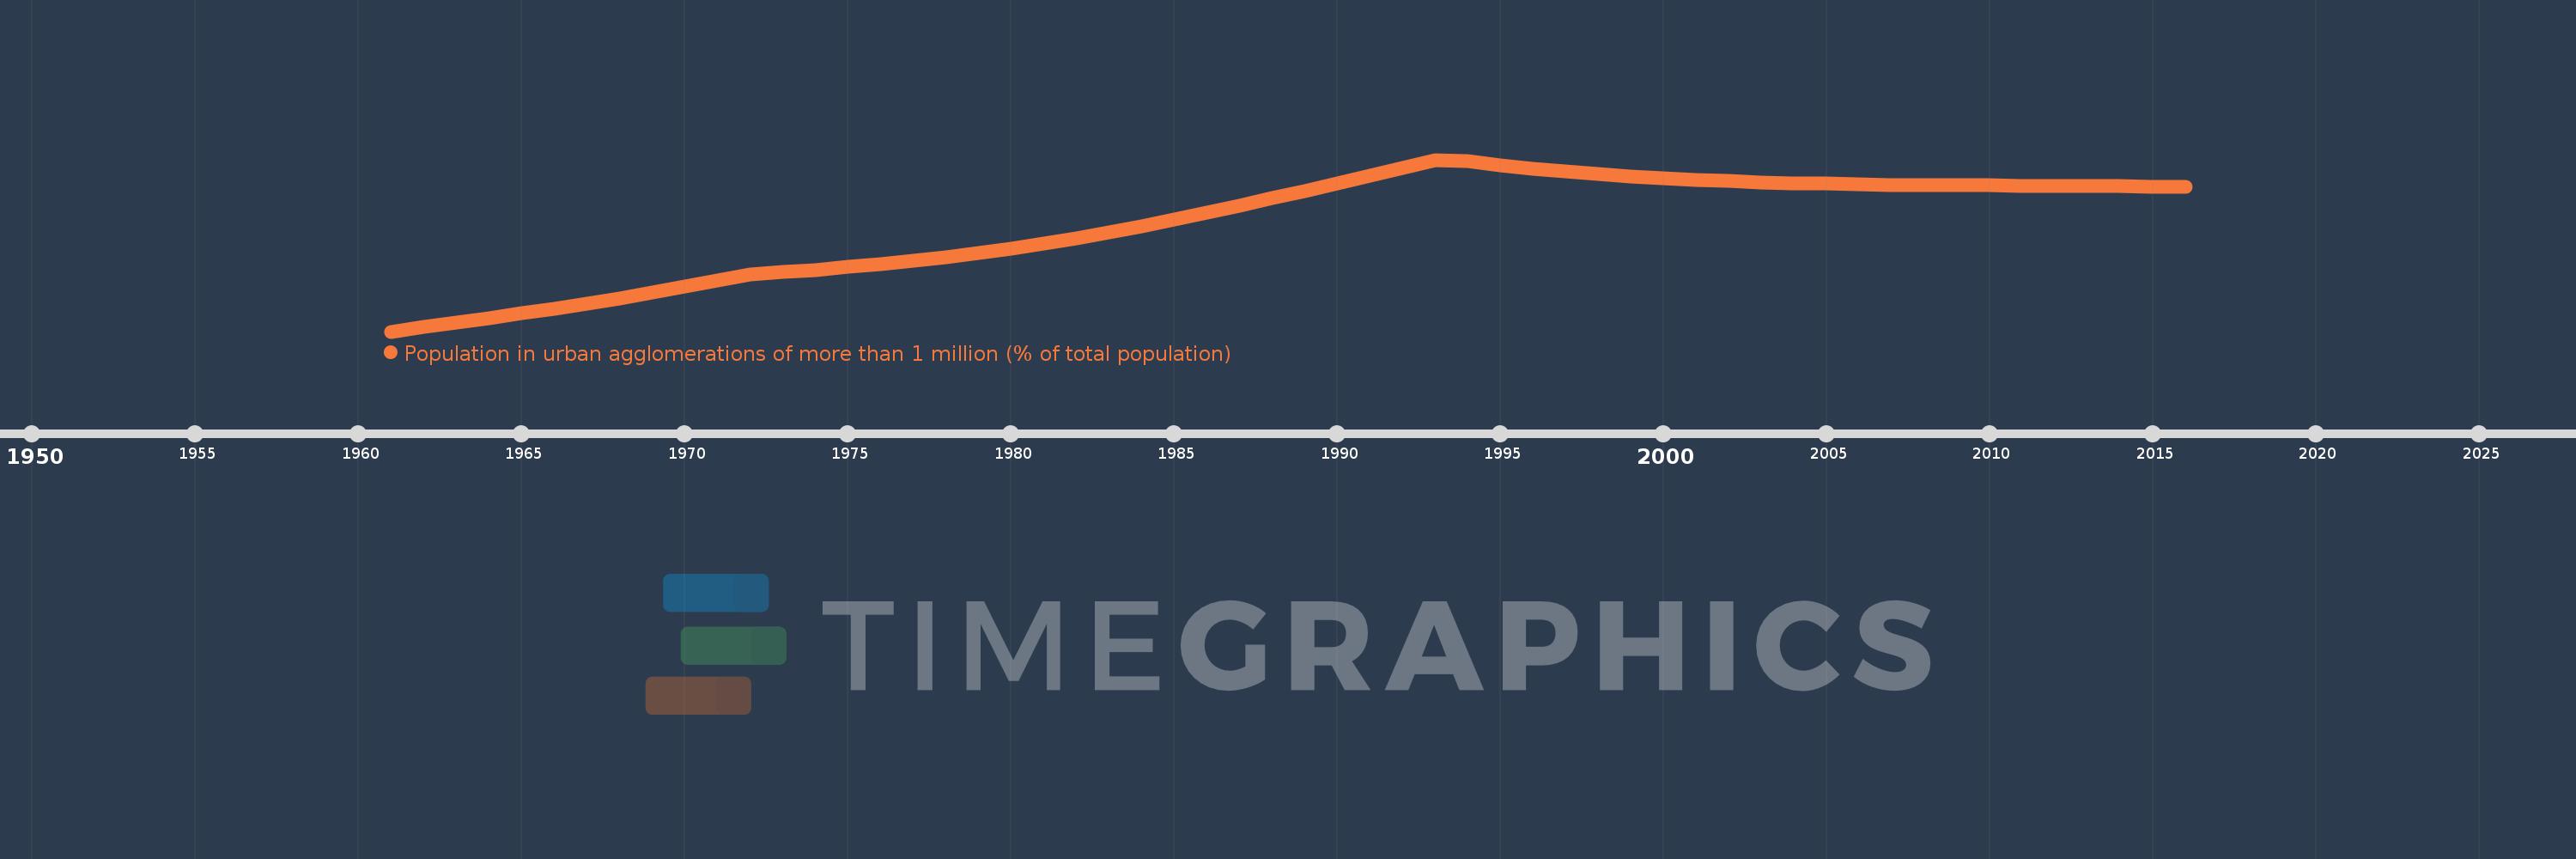
Population in urban agglomerations of more than 1 million (% of total population)
2016,2015,2014,2013,2012,2011,2010,2009,2008,2007,2006,2005,2004,2003,2002,2001,2000,1999,1998,1997,1996,1995,1994,1993,1992,1991,1990,1989,1988,1987,1986,1985,1984,1983,1982,1981,1980,1979,1978,1977,1976,1975,1974,1973,1972,1971,1970,1969,1968,1967,1966,1965,1964,1963,1962,1961
Cette statistique dans les autres pays:
La ligne de temps
Cette échelle de temps montre un graphique de 1961 année à 2016 année El Salvador. Les données jusqu'à 1960 année ne sont pas présentés. Quantité d'observations actuelles selon dates: 56.
Source (désignation):
Les indicateurs du développement mondiale
Source (organisation):
United Nations, World Urbanization Prospects.
Catégories:
Climate Change, Urban Development
Dernière mise à jour
23 avr. 2017
Les indicateurs de changement de valeurs selon les années
Minimum:
11.263
1 janv. 1961
Maximum:
19.188
1 janv. 1993
Pour la date d''observation
Valeur
Changement absolu
Le changement par rapport à la valeur précédente
1 janv. 1961
11.263
+11.263
0.0%
1 janv. 1962
11.474
+0.21
1.87%
1 janv. 1963
11.682
+0.209
1.82%
1 janv. 1964
11.891
+0.209
1.79%
1 janv. 1965
12.106
+0.215
1.81%
1 janv. 1966
12.328
+0.222
1.84%
1 janv. 1967
12.562
+0.234
1.9%
1 janv. 1968
12.808
+0.246
1.96%
1 janv. 1969
13.067
+0.259
2.02%
1 janv. 1970
13.335
+0.268
2.05%
1 janv. 1971
13.616
+0.281
2.11%
1 janv. 1972
13.908
+0.292
2.14%
1 janv. 1973
14.006
+0.099
0.71%
1 janv. 1974
14.115
+0.108
0.77%
1 janv. 1975
14.237
+0.122
0.87%
1 janv. 1976
14.374
+0.137
0.97%
1 janv. 1977
14.528
+0.153
1.07%
1 janv. 1978
14.695
+0.167
1.15%
1 janv. 1979
14.881
+0.186
1.26%
1 janv. 1980
15.087
+0.206
1.39%
1 janv. 1981
15.317
+0.229
1.52%
1 janv. 1982
15.568
+0.251
1.64%
1 janv. 1983
15.842
+0.274
1.76%
1 janv. 1984
16.134
+0.292
1.85%
1 janv. 1985
16.441
+0.307
1.9%
1 janv. 1986
16.755
+0.315
1.91%
1 janv. 1987
17.08
+0.325
1.94%
1 janv. 1988
17.414
+0.335
1.96%
1 janv. 1989
17.758
+0.344
1.97%
1 janv. 1990
18.107
+0.349
1.96%
1 janv. 1991
18.462
+0.355
1.96%
1 janv. 1992
18.821
+0.359
1.95%
1 janv. 1993
19.188
+0.367
1.95%
1 janv. 1994
19.125
-0.063
-0.33%
1 janv. 1995
18.94
-0.185
-0.97%
1 janv. 1996
18.777
-0.162
-0.86%
1 janv. 1997
18.639
-0.139
-0.74%
1 janv. 1998
18.521
-0.118
-0.63%
1 janv. 1999
18.422
-0.099
-0.53%
1 janv. 2000
18.338
-0.084
-0.46%
1 janv. 2001
18.266
-0.072
-0.39%
1 janv. 2002
18.205
-0.061
-0.33%
1 janv. 2003
18.156
-0.05
-0.27%
1 janv. 2004
18.116
-0.04
-0.22%
1 janv. 2005
18.084
-0.032
-0.18%
1 janv. 2006
18.058
-0.026
-0.14%
1 janv. 2007
18.038
-0.02
-0.11%
1 janv. 2008
18.023
-0.015
-0.08%
1 janv. 2009
18.011
-0.012
-0.07%
1 janv. 2010
18.001
-0.01
-0.05%
1 janv. 2011
17.992
-0.009
-0.05%
1 janv. 2012
17.984
-0.009
-0.05%
1 janv. 2013
17.975
-0.009
-0.05%
1 janv. 2014
17.965
-0.01
-0.05%
1 janv. 2015
17.953
-0.012
-0.06%
1 janv. 2016
17.93
-0.023
-0.13%
Classement des pays selon les statistiques actuelles par années


Commentaires: