29
/fr/
fr
AIzaSyAYiBZKx7MnpbEhh9jyipgxe19OcubqV5w
April 1, 2024
239772
Sierra Leone
SLE
true
2
1
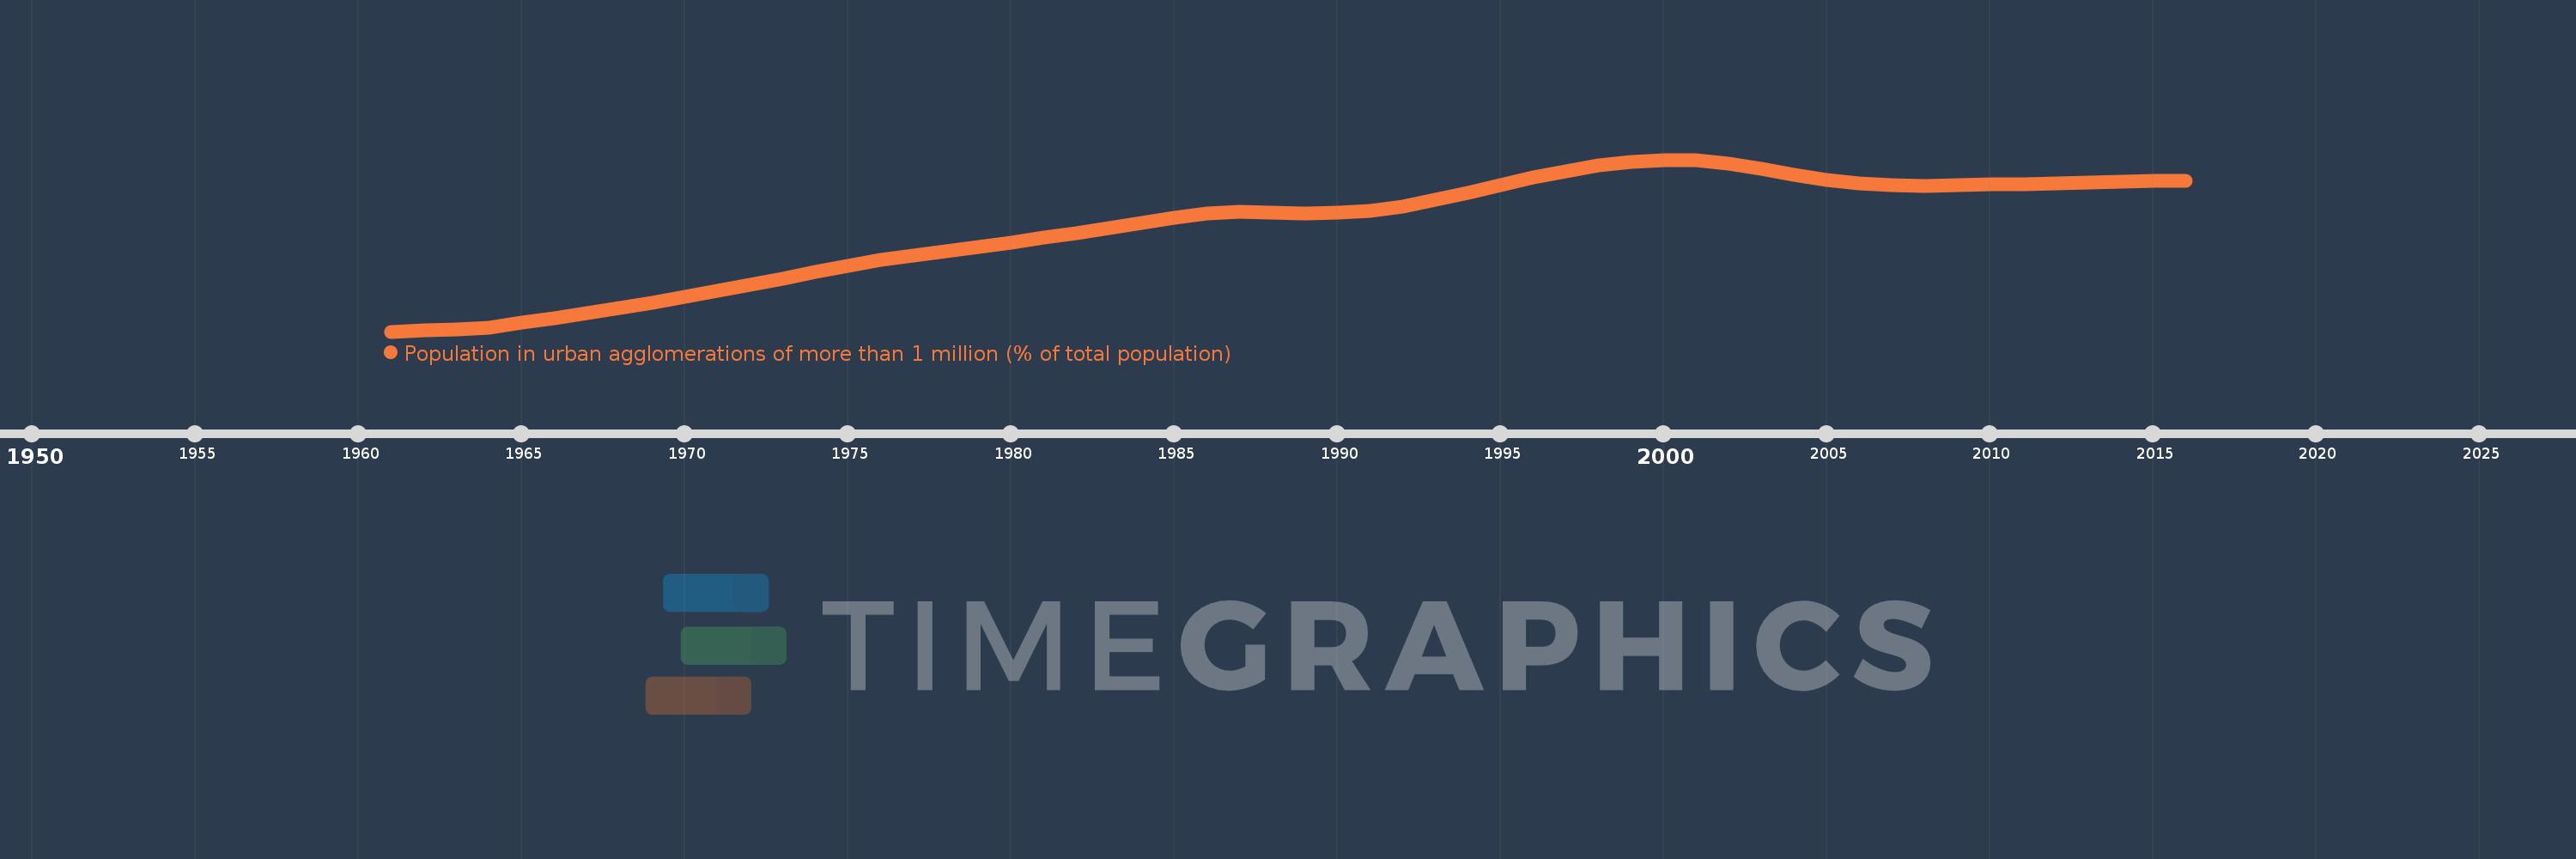
Population in urban agglomerations of more than 1 million (% of total population)
2016,2015,2014,2013,2012,2011,2010,2009,2008,2007,2006,2005,2004,2003,2002,2001,2000,1999,1998,1997,1996,1995,1994,1993,1992,1991,1990,1989,1988,1987,1986,1985,1984,1983,1982,1981,1980,1979,1978,1977,1976,1975,1974,1973,1972,1971,1970,1969,1968,1967,1966,1965,1964,1963,1962,1961
Cette statistique dans les autres pays:
La ligne de temps
Cette échelle de temps montre un graphique de 1961 année à 2016 année Sierra Leone. Les données jusqu'à 1960 année ne sont pas présentés. Quantité d'observations actuelles selon dates: 56.
Source (désignation):
Les indicateurs du développement mondiale
Source (organisation):
United Nations, World Urbanization Prospects.
Catégories:
Climate Change, Urban Development
Dernière mise à jour
23 avr. 2017
Les indicateurs de changement de valeurs selon les années
Minimum:
5.455
1 janv. 1961
Maximum:
17.046
1 janv. 2000
Pour la date d''observation
Valeur
Changement absolu
Le changement par rapport à la valeur précédente
1 janv. 1961
5.455
+5.455
0.0%
1 janv. 1962
5.528
+0.073
1.33%
1 janv. 1963
5.6
+0.072
1.31%
1 janv. 1964
5.729
+0.128
2.29%
1 janv. 1965
6.037
+0.308
5.37%
1 janv. 1966
6.359
+0.322
5.34%
1 janv. 1967
6.697
+0.339
5.33%
1 janv. 1968
7.053
+0.355
5.3%
1 janv. 1969
7.424
+0.371
5.26%
1 janv. 1970
7.807
+0.383
5.16%
1 janv. 1971
8.202
+0.396
5.07%
1 janv. 1972
8.609
+0.407
4.96%
1 janv. 1973
9.029
+0.42
4.87%
1 janv. 1974
9.459
+0.43
4.77%
1 janv. 1975
9.904
+0.445
4.7%
1 janv. 1976
10.269
+0.365
3.69%
1 janv. 1977
10.566
+0.297
2.89%
1 janv. 1978
10.864
+0.298
2.82%
1 janv. 1979
11.167
+0.303
2.78%
1 janv. 1980
11.475
+0.308
2.76%
1 janv. 1981
11.79
+0.315
2.74%
1 janv. 1982
12.117
+0.327
2.77%
1 janv. 1983
12.46
+0.343
2.83%
1 janv. 1984
12.806
+0.346
2.78%
1 janv. 1985
13.138
+0.333
2.6%
1 janv. 1986
13.447
+0.309
2.35%
1 janv. 1987
13.544
+0.097
0.72%
1 janv. 1988
13.468
-0.076
-0.56%
1 janv. 1989
13.418
-0.05
-0.37%
1 janv. 1990
13.454
+0.036
0.27%
1 janv. 1991
13.615
+0.161
1.2%
1 janv. 1992
13.914
+0.299
2.2%
1 janv. 1993
14.334
+0.42
3.02%
1 janv. 1994
14.837
+0.502
3.51%
1 janv. 1995
15.359
+0.522
3.52%
1 janv. 1996
15.84
+0.481
3.13%
1 janv. 1997
16.27
+0.429
2.71%
1 janv. 1998
16.643
+0.374
2.3%
1 janv. 1999
16.919
+0.275
1.65%
1 janv. 2000
17.046
+0.127
0.75%
1 janv. 2001
17.004
-0.042
-0.24%
1 janv. 2002
16.783
-0.221
-1.3%
1 janv. 2003
16.43
-0.353
-2.11%
1 janv. 2004
16.035
-0.394
-2.4%
1 janv. 2005
15.697
-0.338
-2.11%
1 janv. 2006
15.464
-0.233
-1.49%
1 janv. 2007
15.342
-0.122
-0.79%
1 janv. 2008
15.306
-0.037
-0.24%
1 janv. 2009
15.328
+0.023
0.15%
1 janv. 2010
15.374
+0.046
0.3%
1 janv. 2011
15.418
+0.045
0.29%
1 janv. 2012
15.459
+0.041
0.27%
1 janv. 2013
15.505
+0.046
0.3%
1 janv. 2014
15.555
+0.05
0.32%
1 janv. 2015
15.611
+0.055
0.35%
1 janv. 2016
15.607
-0.004
-0.02%
Classement des pays selon les statistiques actuelles par années


Commentaires: