29
/fr/
fr
AIzaSyAYiBZKx7MnpbEhh9jyipgxe19OcubqV5w
April 1, 2024
24542
Arab World
ARB
false
2
1
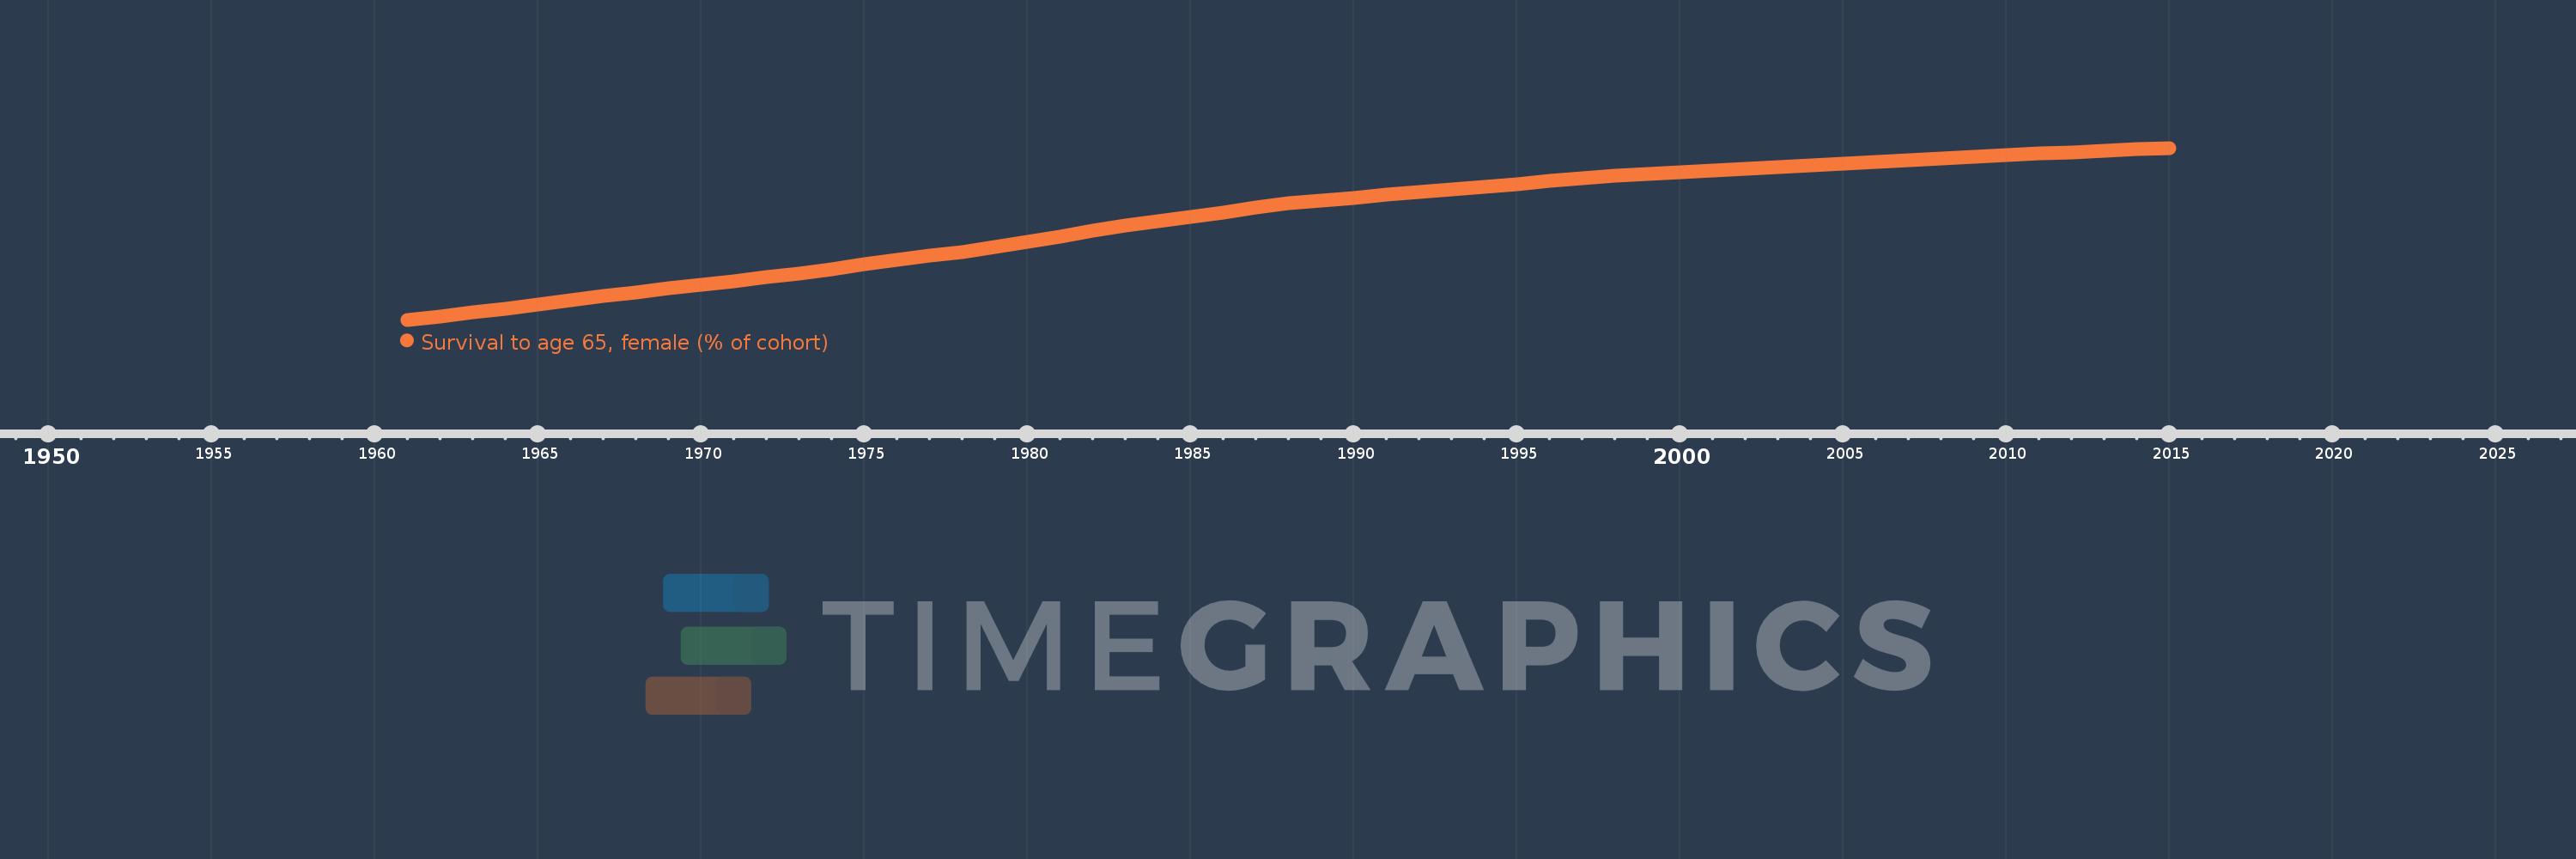
Survival to age 65, female (% of cohort)
2015,2014,2013,2012,2011,2010,2009,2008,2007,2006,2005,2004,2003,2002,2001,2000,1999,1998,1997,1996,1995,1994,1993,1992,1991,1990,1989,1988,1987,1986,1985,1984,1983,1982,1981,1980,1979,1978,1977,1976,1975,1974,1973,1972,1971,1970,1969,1968,1967,1966,1965,1964,1963,1962,1961
Cette statistique dans les autres pays:
AfghanistanAlbaniaAlgeriaAngolaAntigua and BarbudaArab WorldArgentinaArmeniaArubaAustraliaAustriaAzerbaijanBahamas, TheBahrainBangladeshBarbadosBelarusBelgiumBelizeBeninBhutanBoliviaBosnia and HerzegovinaBotswanaBrazilBrunei DarussalamBulgariaBurkina FasoBurundiCabo VerdeCambodiaCameroonCanadaCaribbean small statesCentral African RepublicCentral Europe and the BalticsChadChannel IslandsChileChinaColombiaComorosCongo, Dem. Rep.Congo, Rep.Costa RicaCote d'IvoireCroatiaCubaCuracaoCyprusCzech RepublicDenmarkDjiboutiDominican RepublicEarly-demographic dividendEast Asia & PacificEast Asia & Pacific (excluding high income)East Asia & Pacific (IDA & IBRD countries)EcuadorEgypt, Arab Rep.El SalvadorEquatorial GuineaEritreaEstoniaEthiopiaEuro areaEurope & Central AsiaEurope & Central Asia (excluding high income)Europe & Central Asia (IDA & IBRD countries)European UnionFijiFinlandFragile and conflict affected situationsFranceFrench PolynesiaGabonGambia, TheGeorgiaGermanyGhanaGreeceGrenadaGuamGuatemalaGuineaGuinea-BissauGuyanaHaitiHeavily indebted poor countries (HIPC)High incomeHondurasHong Kong SAR, ChinaHungaryIBRD onlyIcelandIDA & IBRD totalIDA blendIDA onlyIDA totalIndiaIndonesiaIran, Islamic Rep.IraqIrelandIsraelItalyJamaicaJapanJordanKazakhstanKenyaKiribatiKorea, Dem. People’s Rep.Korea, Rep.KuwaitKyrgyz RepublicLao PDRLate-demographic dividendLatin America & Caribbean Latin America & Caribbean (excluding high income)Latin America & the Caribbean (IDA & IBRD countries)LatviaLeast developed countries: UN classificationLebanonLesothoLiberiaLibyaLithuaniaLow & middle incomeLow incomeLower middle incomeLuxembourgMacao SAR, ChinaMacedonia, FYRMadagascarMalawiMalaysiaMaldivesMaliMaltaMauritaniaMauritiusMexicoMicronesia, Fed. Sts.Middle East & North AfricaMiddle East & North Africa (excluding high income)Middle East & North Africa (IDA & IBRD countries)Middle incomeMoldovaMongoliaMontenegroMoroccoMozambiqueMyanmarNamibiaNepalNetherlandsNew CaledoniaNew ZealandNicaraguaNigerNigeriaNorth AmericaNorwayOECD membersOmanOther small statesPacific island small statesPakistanPanamaPapua New GuineaParaguayPeruPhilippinesPolandPortugalPost-demographic dividendPre-demographic dividendPuerto RicoQatarRomaniaRussian FederationRwandaSamoaSao Tome and PrincipeSaudi ArabiaSenegalSerbiaSeychellesSierra LeoneSingaporeSlovak RepublicSloveniaSmall statesSolomon IslandsSomaliaSouth AfricaSouth AsiaSouth Asia (IDA & IBRD)South SudanSpainSri LankaSt. LuciaSt. Vincent and the GrenadinesSub-Saharan Africa Sub-Saharan Africa (excluding high income)Sub-Saharan Africa (IDA & IBRD countries)SudanSurinameSwazilandSwedenSwitzerlandSyrian Arab RepublicTajikistanTanzaniaThailandTimor-LesteTogoTongaTrinidad and TobagoTunisiaTurkeyTurkmenistanUgandaUkraineUnited Arab EmiratesUnited KingdomUnited StatesUpper middle incomeUruguayUzbekistanVanuatuVenezuela, RBVietnamVirgin Islands (U.S.)West Bank and GazaWorldYemen, Rep.ZambiaZimbabwe La ligne de temps
Cette échelle de temps montre un graphique de 1961 année à 2015 année Arab World. Les données jusqu'à 1960 année ne sont pas présentés. Quantité d'observations actuelles selon dates: 55.
Source (désignation):
Les indicateurs du développement mondiale
Source (organisation):
United Nations Population Division. World Population Prospects. New York, United Nations, Department of Economic and Social Affairs (advanced Excel tables). Available at http://esa.un.org/wpp/unpp/panel_population.htm.
Catégories:
Health, Gender
Dernière mise à jour
23 avr. 2017
Les indicateurs de changement de valeurs selon les années
Minimum:
44.771
1 janv. 1961
Maximum:
79.38
1 janv. 2015
Pour la date d''observation
Valeur
Changement absolu
Le changement par rapport à la valeur précédente
1 janv. 1961
44.771
+44.771
0.0%
1 janv. 1962
45.487
+0.716
1.6%
1 janv. 1963
46.212
+0.725
1.59%
1 janv. 1964
47.038
+0.826
1.79%
1 janv. 1965
47.862
+0.824
1.75%
1 janv. 1966
48.682
+0.82
1.71%
1 janv. 1967
49.5
+0.818
1.68%
1 janv. 1968
50.313
+0.814
1.64%
1 janv. 1969
51.053
+0.74
1.47%
1 janv. 1970
51.797
+0.744
1.46%
1 janv. 1971
52.546
+0.749
1.45%
1 janv. 1972
53.306
+0.76
1.45%
1 janv. 1973
54.069
+0.763
1.43%
1 janv. 1974
54.984
+0.915
1.69%
1 janv. 1975
55.883
+0.9
1.64%
1 janv. 1976
56.764
+0.881
1.58%
1 janv. 1977
57.612
+0.848
1.49%
1 janv. 1978
58.442
+0.83
1.44%
1 janv. 1979
59.461
+1.02
1.74%
1 janv. 1980
60.491
+1.03
1.73%
1 janv. 1981
61.541
+1.05
1.74%
1 janv. 1982
62.636
+1.095
1.78%
1 janv. 1983
63.752
+1.116
1.78%
1 janv. 1984
64.647
+0.895
1.4%
1 janv. 1985
65.542
+0.894
1.38%
1 janv. 1986
66.43
+0.889
1.36%
1 janv. 1987
67.309
+0.879
1.32%
1 janv. 1988
68.18
+0.871
1.29%
1 janv. 1989
68.776
+0.596
0.87%
1 janv. 1990
69.362
+0.586
0.85%
1 janv. 1991
69.979
+0.617
0.89%
1 janv. 1992
70.561
+0.583
0.83%
1 janv. 1993
71.024
+0.462
0.66%
1 janv. 1994
71.567
+0.543
0.77%
1 janv. 1995
72.113
+0.546
0.76%
1 janv. 1996
72.73
+0.617
0.86%
1 janv. 1997
73.281
+0.551
0.76%
1 janv. 1998
73.829
+0.548
0.75%
1 janv. 1999
74.165
+0.336
0.45%
1 janv. 2000
74.497
+0.332
0.45%
1 janv. 2001
74.823
+0.327
0.44%
1 janv. 2002
75.146
+0.323
0.43%
1 janv. 2003
75.468
+0.321
0.43%
1 janv. 2004
75.811
+0.344
0.46%
1 janv. 2005
76.154
+0.342
0.45%
1 janv. 2006
76.495
+0.342
0.45%
1 janv. 2007
76.853
+0.357
0.47%
1 janv. 2008
77.208
+0.355
0.46%
1 janv. 2009
77.551
+0.343
0.44%
1 janv. 2010
77.886
+0.335
0.43%
1 janv. 2011
78.213
+0.327
0.42%
1 janv. 2012
78.526
+0.313
0.4%
1 janv. 2013
78.835
+0.309
0.39%
1 janv. 2014
79.11
+0.275
0.35%
1 janv. 2015
79.38
+0.27
0.34%
Classement des pays selon les statistiques actuelles par années


Commentaires: