29
/fr/
fr
AIzaSyAYiBZKx7MnpbEhh9jyipgxe19OcubqV5w
April 1, 2024
139802
Germany
DEU
true
2
1
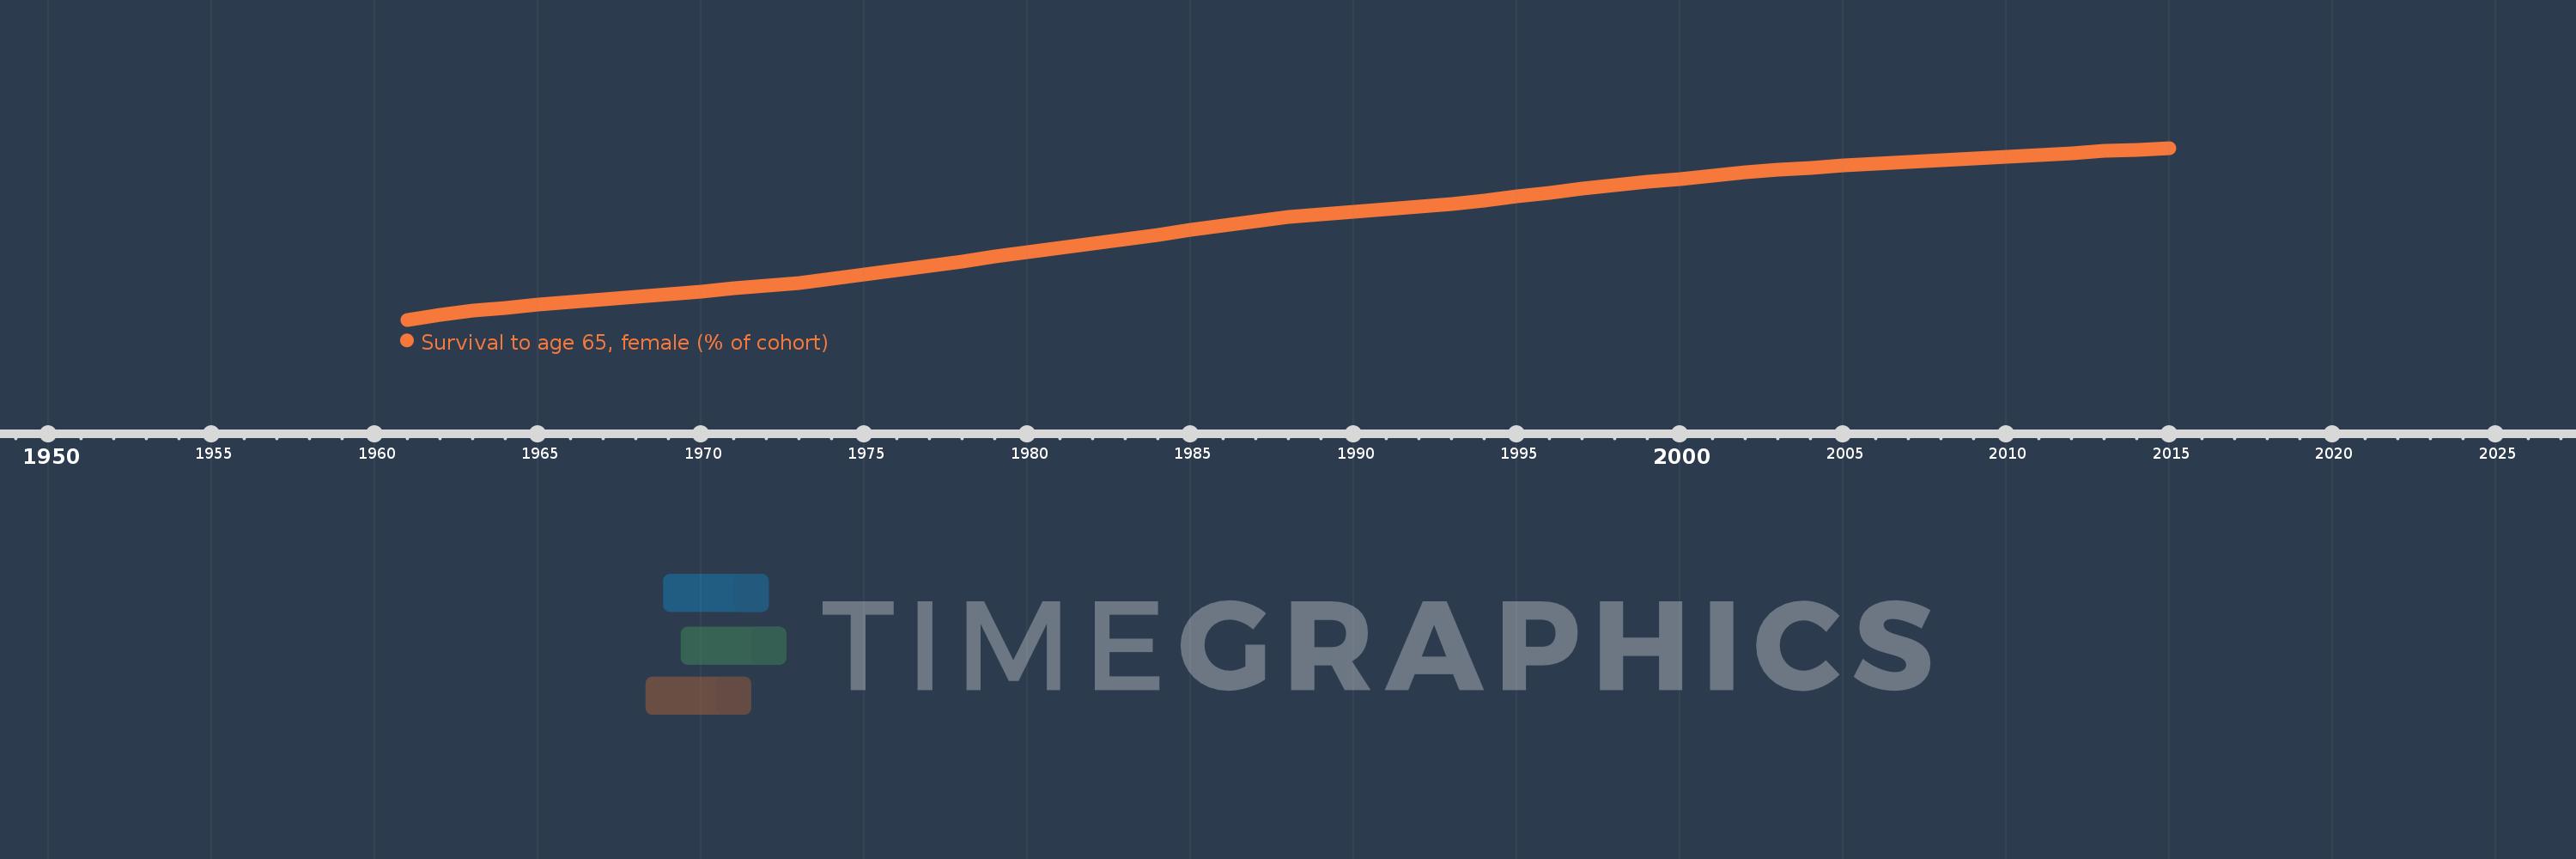
Survival to age 65, female (% of cohort)
2015,2014,2013,2012,2011,2010,2009,2008,2007,2006,2005,2004,2003,2002,2001,2000,1999,1998,1997,1996,1995,1994,1993,1992,1991,1990,1989,1988,1987,1986,1985,1984,1983,1982,1981,1980,1979,1978,1977,1976,1975,1974,1973,1972,1971,1970,1969,1968,1967,1966,1965,1964,1963,1962,1961
Cette statistique dans les autres pays:
AfghanistanAlbaniaAlgeriaAngolaAntigua and BarbudaArab WorldArgentinaArmeniaArubaAustraliaAustriaAzerbaijanBahamas, TheBahrainBangladeshBarbadosBelarusBelgiumBelizeBeninBhutanBoliviaBosnia and HerzegovinaBotswanaBrazilBrunei DarussalamBulgariaBurkina FasoBurundiCabo VerdeCambodiaCameroonCanadaCaribbean small statesCentral African RepublicCentral Europe and the BalticsChadChannel IslandsChileChinaColombiaComorosCongo, Dem. Rep.Congo, Rep.Costa RicaCote d'IvoireCroatiaCubaCuracaoCyprusCzech RepublicDenmarkDjiboutiDominican RepublicEarly-demographic dividendEast Asia & PacificEast Asia & Pacific (excluding high income)East Asia & Pacific (IDA & IBRD countries)EcuadorEgypt, Arab Rep.El SalvadorEquatorial GuineaEritreaEstoniaEthiopiaEuro areaEurope & Central AsiaEurope & Central Asia (excluding high income)Europe & Central Asia (IDA & IBRD countries)European UnionFijiFinlandFragile and conflict affected situationsFranceFrench PolynesiaGabonGambia, TheGeorgiaGermanyGhanaGreeceGrenadaGuamGuatemalaGuineaGuinea-BissauGuyanaHaitiHeavily indebted poor countries (HIPC)High incomeHondurasHong Kong SAR, ChinaHungaryIBRD onlyIcelandIDA & IBRD totalIDA blendIDA onlyIDA totalIndiaIndonesiaIran, Islamic Rep.IraqIrelandIsraelItalyJamaicaJapanJordanKazakhstanKenyaKiribatiKorea, Dem. People’s Rep.Korea, Rep.KuwaitKyrgyz RepublicLao PDRLate-demographic dividendLatin America & Caribbean Latin America & Caribbean (excluding high income)Latin America & the Caribbean (IDA & IBRD countries)LatviaLeast developed countries: UN classificationLebanonLesothoLiberiaLibyaLithuaniaLow & middle incomeLow incomeLower middle incomeLuxembourgMacao SAR, ChinaMacedonia, FYRMadagascarMalawiMalaysiaMaldivesMaliMaltaMauritaniaMauritiusMexicoMicronesia, Fed. Sts.Middle East & North AfricaMiddle East & North Africa (excluding high income)Middle East & North Africa (IDA & IBRD countries)Middle incomeMoldovaMongoliaMontenegroMoroccoMozambiqueMyanmarNamibiaNepalNetherlandsNew CaledoniaNew ZealandNicaraguaNigerNigeriaNorth AmericaNorwayOECD membersOmanOther small statesPacific island small statesPakistanPanamaPapua New GuineaParaguayPeruPhilippinesPolandPortugalPost-demographic dividendPre-demographic dividendPuerto RicoQatarRomaniaRussian FederationRwandaSamoaSao Tome and PrincipeSaudi ArabiaSenegalSerbiaSeychellesSierra LeoneSingaporeSlovak RepublicSloveniaSmall statesSolomon IslandsSomaliaSouth AfricaSouth AsiaSouth Asia (IDA & IBRD)South SudanSpainSri LankaSt. LuciaSt. Vincent and the GrenadinesSub-Saharan Africa Sub-Saharan Africa (excluding high income)Sub-Saharan Africa (IDA & IBRD countries)SudanSurinameSwazilandSwedenSwitzerlandSyrian Arab RepublicTajikistanTanzaniaThailandTimor-LesteTogoTongaTrinidad and TobagoTunisiaTurkeyTurkmenistanUgandaUkraineUnited Arab EmiratesUnited KingdomUnited StatesUpper middle incomeUruguayUzbekistanVanuatuVenezuela, RBVietnamVirgin Islands (U.S.)West Bank and GazaWorldYemen, Rep.ZambiaZimbabwe La ligne de temps
Cette échelle de temps montre un graphique de 1961 année à 2015 année Germany. Les données jusqu'à 1960 année ne sont pas présentés. Quantité d'observations actuelles selon dates: 55.
Source (désignation):
Les indicateurs du développement mondiale
Source (organisation):
United Nations Population Division. World Population Prospects. New York, United Nations, Department of Economic and Social Affairs (advanced Excel tables). Available at http://esa.un.org/wpp/unpp/panel_population.htm.
Catégories:
Health, Gender
Dernière mise à jour
23 avr. 2017
Les indicateurs de changement de valeurs selon les années
Minimum:
79.363
1 janv. 1961
Maximum:
92.013
1 janv. 2015
Pour la date d''observation
Valeur
Changement absolu
Le changement par rapport à la valeur précédente
1 janv. 1961
79.363
+79.363
0.0%
1 janv. 1962
79.7
+0.337
0.42%
1 janv. 1963
80.037
+0.337
0.42%
1 janv. 1964
80.245
+0.207
0.26%
1 janv. 1965
80.452
+0.207
0.26%
1 janv. 1966
80.659
+0.207
0.26%
1 janv. 1967
80.867
+0.207
0.26%
1 janv. 1968
81.074
+0.207
0.26%
1 janv. 1969
81.268
+0.194
0.24%
1 janv. 1970
81.462
+0.194
0.24%
1 janv. 1971
81.656
+0.194
0.24%
1 janv. 1972
81.85
+0.194
0.24%
1 janv. 1973
82.043
+0.194
0.24%
1 janv. 1974
82.37
+0.326
0.4%
1 janv. 1975
82.696
+0.326
0.4%
1 janv. 1976
83.022
+0.326
0.39%
1 janv. 1977
83.348
+0.326
0.39%
1 janv. 1978
83.675
+0.326
0.39%
1 janv. 1979
84.003
+0.328
0.39%
1 janv. 1980
84.331
+0.328
0.39%
1 janv. 1981
84.659
+0.328
0.39%
1 janv. 1982
84.987
+0.328
0.39%
1 janv. 1983
85.316
+0.328
0.39%
1 janv. 1984
85.637
+0.321
0.38%
1 janv. 1985
85.959
+0.321
0.38%
1 janv. 1986
86.28
+0.321
0.37%
1 janv. 1987
86.601
+0.321
0.37%
1 janv. 1988
86.923
+0.321
0.37%
1 janv. 1989
87.114
+0.191
0.22%
1 janv. 1990
87.305
+0.191
0.22%
1 janv. 1991
87.496
+0.191
0.22%
1 janv. 1992
87.688
+0.191
0.22%
1 janv. 1993
87.879
+0.191
0.22%
1 janv. 1994
88.162
+0.283
0.32%
1 janv. 1995
88.446
+0.283
0.32%
1 janv. 1996
88.729
+0.283
0.32%
1 janv. 1997
89.013
+0.283
0.32%
1 janv. 1998
89.296
+0.283
0.32%
1 janv. 1999
89.521
+0.225
0.25%
1 janv. 2000
89.745
+0.225
0.25%
1 janv. 2001
89.97
+0.225
0.25%
1 janv. 2002
90.194
+0.225
0.25%
1 janv. 2003
90.419
+0.225
0.25%
1 janv. 2004
90.56
+0.142
0.16%
1 janv. 2005
90.702
+0.142
0.16%
1 janv. 2006
90.844
+0.142
0.16%
1 janv. 2007
90.986
+0.142
0.16%
1 janv. 2008
91.127
+0.142
0.16%
1 janv. 2009
91.256
+0.129
0.14%
1 janv. 2010
91.385
+0.129
0.14%
1 janv. 2011
91.514
+0.129
0.14%
1 janv. 2012
91.644
+0.129
0.14%
1 janv. 2013
91.773
+0.129
0.14%
1 janv. 2014
91.893
+0.12
0.13%
1 janv. 2015
92.013
+0.12
0.13%
Classement des pays selon les statistiques actuelles par années


Commentaires: