29
/fr/
fr
AIzaSyAYiBZKx7MnpbEhh9jyipgxe19OcubqV5w
April 1, 2024
135070
French Polynesia
PYF
true
2
1
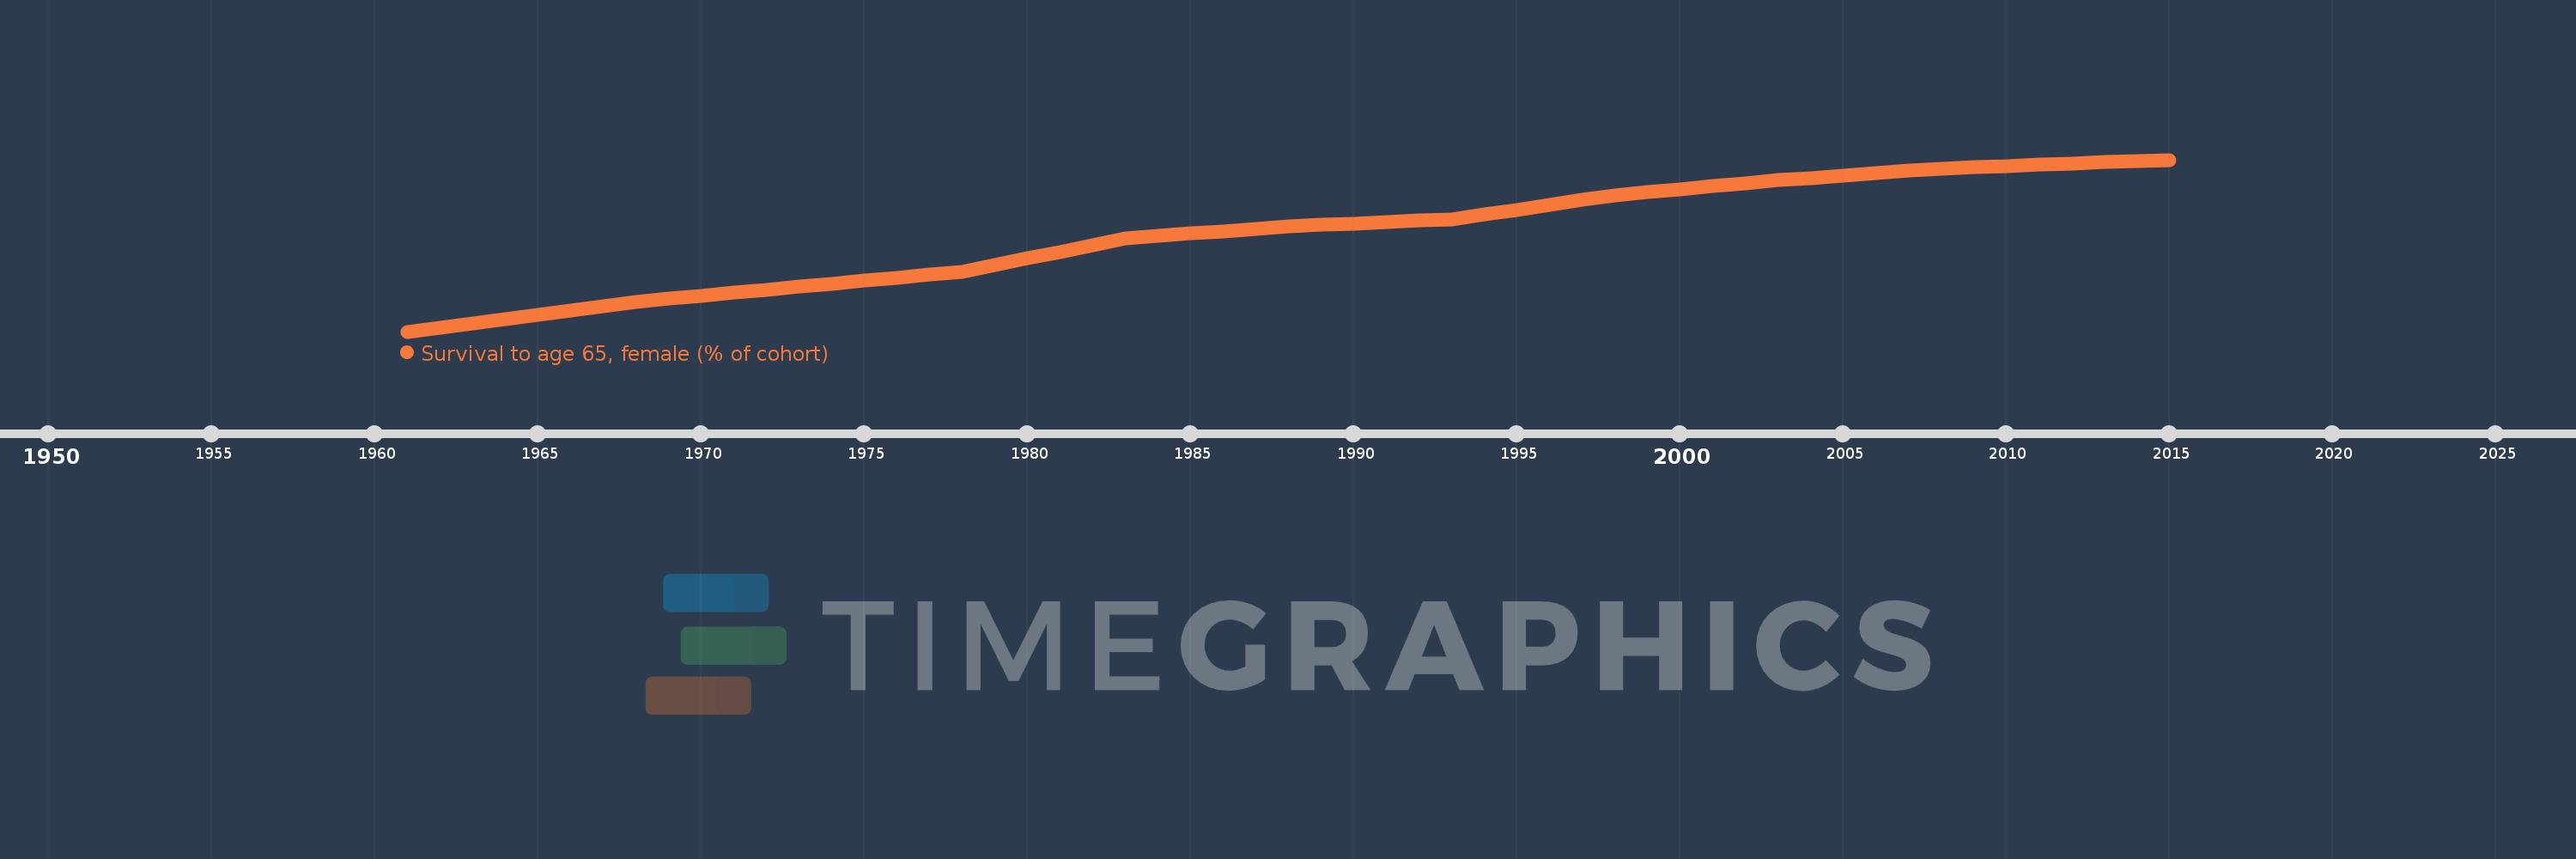
Survival to age 65, female (% of cohort)
2015,2014,2013,2012,2011,2010,2009,2008,2007,2006,2005,2004,2003,2002,2001,2000,1999,1998,1997,1996,1995,1994,1993,1992,1991,1990,1989,1988,1987,1986,1985,1984,1983,1982,1981,1980,1979,1978,1977,1976,1975,1974,1973,1972,1971,1970,1969,1968,1967,1966,1965,1964,1963,1962,1961
Cette statistique dans les autres pays:
AfghanistanAlbaniaAlgeriaAngolaAntigua and BarbudaArab WorldArgentinaArmeniaArubaAustraliaAustriaAzerbaijanBahamas, TheBahrainBangladeshBarbadosBelarusBelgiumBelizeBeninBhutanBoliviaBosnia and HerzegovinaBotswanaBrazilBrunei DarussalamBulgariaBurkina FasoBurundiCabo VerdeCambodiaCameroonCanadaCaribbean small statesCentral African RepublicCentral Europe and the BalticsChadChannel IslandsChileChinaColombiaComorosCongo, Dem. Rep.Congo, Rep.Costa RicaCote d'IvoireCroatiaCubaCuracaoCyprusCzech RepublicDenmarkDjiboutiDominican RepublicEarly-demographic dividendEast Asia & PacificEast Asia & Pacific (excluding high income)East Asia & Pacific (IDA & IBRD countries)EcuadorEgypt, Arab Rep.El SalvadorEquatorial GuineaEritreaEstoniaEthiopiaEuro areaEurope & Central AsiaEurope & Central Asia (excluding high income)Europe & Central Asia (IDA & IBRD countries)European UnionFijiFinlandFragile and conflict affected situationsFranceFrench PolynesiaGabonGambia, TheGeorgiaGermanyGhanaGreeceGrenadaGuamGuatemalaGuineaGuinea-BissauGuyanaHaitiHeavily indebted poor countries (HIPC)High incomeHondurasHong Kong SAR, ChinaHungaryIBRD onlyIcelandIDA & IBRD totalIDA blendIDA onlyIDA totalIndiaIndonesiaIran, Islamic Rep.IraqIrelandIsraelItalyJamaicaJapanJordanKazakhstanKenyaKiribatiKorea, Dem. People’s Rep.Korea, Rep.KuwaitKyrgyz RepublicLao PDRLate-demographic dividendLatin America & Caribbean Latin America & Caribbean (excluding high income)Latin America & the Caribbean (IDA & IBRD countries)LatviaLeast developed countries: UN classificationLebanonLesothoLiberiaLibyaLithuaniaLow & middle incomeLow incomeLower middle incomeLuxembourgMacao SAR, ChinaMacedonia, FYRMadagascarMalawiMalaysiaMaldivesMaliMaltaMauritaniaMauritiusMexicoMicronesia, Fed. Sts.Middle East & North AfricaMiddle East & North Africa (excluding high income)Middle East & North Africa (IDA & IBRD countries)Middle incomeMoldovaMongoliaMontenegroMoroccoMozambiqueMyanmarNamibiaNepalNetherlandsNew CaledoniaNew ZealandNicaraguaNigerNigeriaNorth AmericaNorwayOECD membersOmanOther small statesPacific island small statesPakistanPanamaPapua New GuineaParaguayPeruPhilippinesPolandPortugalPost-demographic dividendPre-demographic dividendPuerto RicoQatarRomaniaRussian FederationRwandaSamoaSao Tome and PrincipeSaudi ArabiaSenegalSerbiaSeychellesSierra LeoneSingaporeSlovak RepublicSloveniaSmall statesSolomon IslandsSomaliaSouth AfricaSouth AsiaSouth Asia (IDA & IBRD)South SudanSpainSri LankaSt. LuciaSt. Vincent and the GrenadinesSub-Saharan Africa Sub-Saharan Africa (excluding high income)Sub-Saharan Africa (IDA & IBRD countries)SudanSurinameSwazilandSwedenSwitzerlandSyrian Arab RepublicTajikistanTanzaniaThailandTimor-LesteTogoTongaTrinidad and TobagoTunisiaTurkeyTurkmenistanUgandaUkraineUnited Arab EmiratesUnited KingdomUnited StatesUpper middle incomeUruguayUzbekistanVanuatuVenezuela, RBVietnamVirgin Islands (U.S.)West Bank and GazaWorldYemen, Rep.ZambiaZimbabwe La ligne de temps
Cette échelle de temps montre un graphique de 1961 année à 2015 année French Polynesia. Les données jusqu'à 1960 année ne sont pas présentés. Quantité d'observations actuelles selon dates: 55.
Source (désignation):
Les indicateurs du développement mondiale
Source (organisation):
United Nations Population Division. World Population Prospects. New York, United Nations, Department of Economic and Social Affairs (advanced Excel tables). Available at http://esa.un.org/wpp/unpp/panel_population.htm.
Catégories:
Health, Gender
Dernière mise à jour
23 avr. 2017
Les indicateurs de changement de valeurs selon les années
Minimum:
50.363
1 janv. 1961
Maximum:
87.058
1 janv. 2015
Pour la date d''observation
Valeur
Changement absolu
Le changement par rapport à la valeur précédente
1 janv. 1961
50.363
+50.363
0.0%
1 janv. 1962
51.249
+0.886
1.76%
1 janv. 1963
52.135
+0.886
1.73%
1 janv. 1964
53.05
+0.915
1.76%
1 janv. 1965
53.965
+0.915
1.72%
1 janv. 1966
54.88
+0.915
1.7%
1 janv. 1967
55.795
+0.915
1.67%
1 janv. 1968
56.71
+0.915
1.64%
1 janv. 1969
57.352
+0.642
1.13%
1 janv. 1970
57.994
+0.642
1.12%
1 janv. 1971
58.636
+0.642
1.11%
1 janv. 1972
59.278
+0.642
1.09%
1 janv. 1973
59.92
+0.642
1.08%
1 janv. 1974
60.563
+0.643
1.07%
1 janv. 1975
61.206
+0.643
1.06%
1 janv. 1976
61.849
+0.643
1.05%
1 janv. 1977
62.492
+0.643
1.04%
1 janv. 1978
63.135
+0.643
1.03%
1 janv. 1979
64.564
+1.429
2.26%
1 janv. 1980
65.992
+1.429
2.21%
1 janv. 1981
67.421
+1.429
2.16%
1 janv. 1982
68.849
+1.429
2.12%
1 janv. 1983
70.278
+1.429
2.07%
1 janv. 1984
70.787
+0.509
0.72%
1 janv. 1985
71.297
+0.509
0.72%
1 janv. 1986
71.806
+0.509
0.71%
1 janv. 1987
72.315
+0.509
0.71%
1 janv. 1988
72.824
+0.509
0.7%
1 janv. 1989
73.134
+0.31
0.43%
1 janv. 1990
73.443
+0.31
0.42%
1 janv. 1991
73.753
+0.31
0.42%
1 janv. 1992
74.062
+0.31
0.42%
1 janv. 1993
74.372
+0.31
0.42%
1 janv. 1994
75.393
+1.021
1.37%
1 janv. 1995
76.413
+1.021
1.35%
1 janv. 1996
77.434
+1.021
1.34%
1 janv. 1997
78.454
+1.021
1.32%
1 janv. 1998
79.475
+1.021
1.3%
1 janv. 1999
80.123
+0.648
0.81%
1 janv. 2000
80.77
+0.648
0.81%
1 janv. 2001
81.418
+0.648
0.8%
1 janv. 2002
82.065
+0.648
0.8%
1 janv. 2003
82.713
+0.648
0.79%
1 janv. 2004
83.203
+0.49
0.59%
1 janv. 2005
83.693
+0.49
0.59%
1 janv. 2006
84.184
+0.49
0.59%
1 janv. 2007
84.674
+0.49
0.58%
1 janv. 2008
85.164
+0.49
0.58%
1 janv. 2009
85.446
+0.282
0.33%
1 janv. 2010
85.728
+0.282
0.33%
1 janv. 2011
86.01
+0.282
0.33%
1 janv. 2012
86.292
+0.282
0.33%
1 janv. 2013
86.574
+0.282
0.33%
1 janv. 2014
86.816
+0.242
0.28%
1 janv. 2015
87.058
+0.242
0.28%
Classement des pays selon les statistiques actuelles par années


Commentaires: