29
/fr/
fr
AIzaSyAYiBZKx7MnpbEhh9jyipgxe19OcubqV5w
April 1, 2024
122898
Dominican Republic
DOM
true
2
1
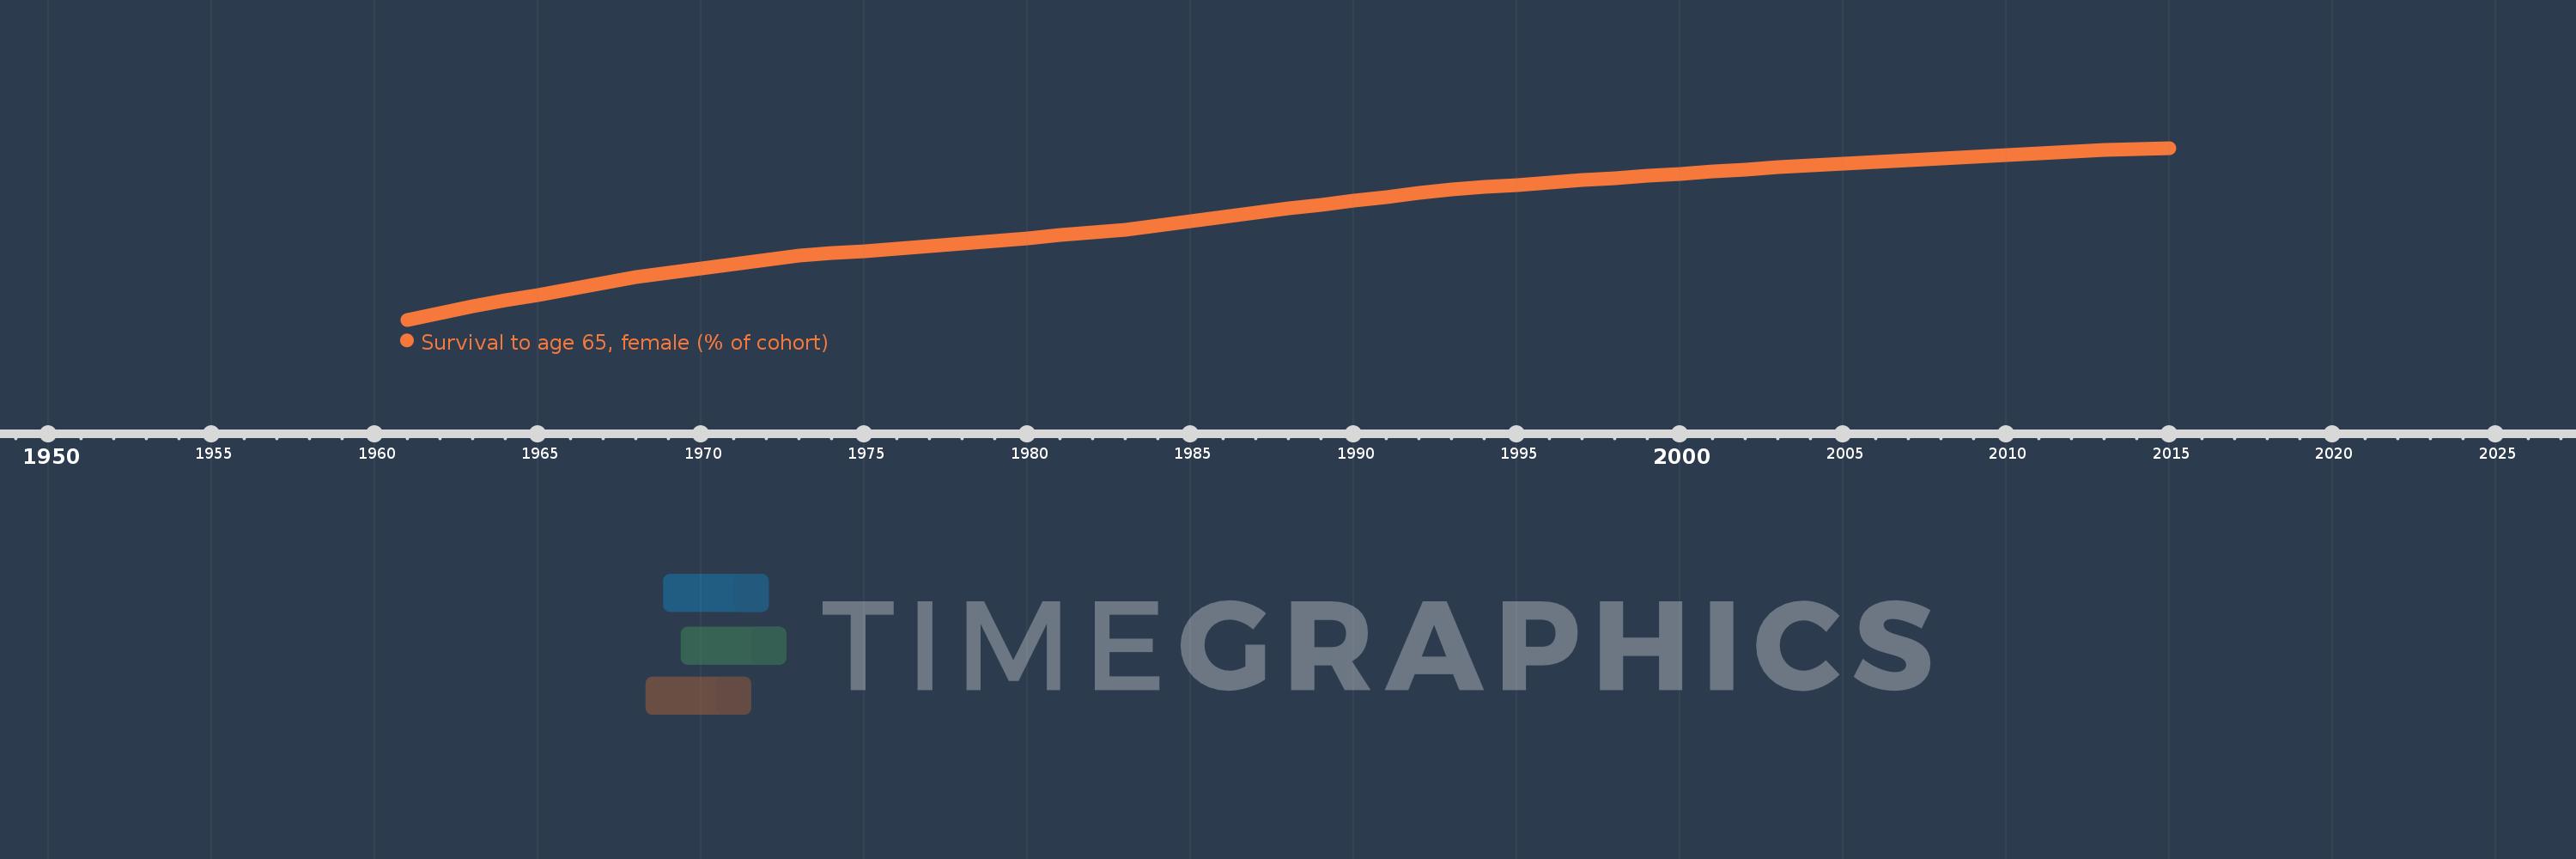
Survival to age 65, female (% of cohort)
2015,2014,2013,2012,2011,2010,2009,2008,2007,2006,2005,2004,2003,2002,2001,2000,1999,1998,1997,1996,1995,1994,1993,1992,1991,1990,1989,1988,1987,1986,1985,1984,1983,1982,1981,1980,1979,1978,1977,1976,1975,1974,1973,1972,1971,1970,1969,1968,1967,1966,1965,1964,1963,1962,1961
Cette statistique dans les autres pays:
AfghanistanAlbaniaAlgeriaAngolaAntigua and BarbudaArab WorldArgentinaArmeniaArubaAustraliaAustriaAzerbaijanBahamas, TheBahrainBangladeshBarbadosBelarusBelgiumBelizeBeninBhutanBoliviaBosnia and HerzegovinaBotswanaBrazilBrunei DarussalamBulgariaBurkina FasoBurundiCabo VerdeCambodiaCameroonCanadaCaribbean small statesCentral African RepublicCentral Europe and the BalticsChadChannel IslandsChileChinaColombiaComorosCongo, Dem. Rep.Congo, Rep.Costa RicaCote d'IvoireCroatiaCubaCuracaoCyprusCzech RepublicDenmarkDjiboutiDominican RepublicEarly-demographic dividendEast Asia & PacificEast Asia & Pacific (excluding high income)East Asia & Pacific (IDA & IBRD countries)EcuadorEgypt, Arab Rep.El SalvadorEquatorial GuineaEritreaEstoniaEthiopiaEuro areaEurope & Central AsiaEurope & Central Asia (excluding high income)Europe & Central Asia (IDA & IBRD countries)European UnionFijiFinlandFragile and conflict affected situationsFranceFrench PolynesiaGabonGambia, TheGeorgiaGermanyGhanaGreeceGrenadaGuamGuatemalaGuineaGuinea-BissauGuyanaHaitiHeavily indebted poor countries (HIPC)High incomeHondurasHong Kong SAR, ChinaHungaryIBRD onlyIcelandIDA & IBRD totalIDA blendIDA onlyIDA totalIndiaIndonesiaIran, Islamic Rep.IraqIrelandIsraelItalyJamaicaJapanJordanKazakhstanKenyaKiribatiKorea, Dem. People’s Rep.Korea, Rep.KuwaitKyrgyz RepublicLao PDRLate-demographic dividendLatin America & Caribbean Latin America & Caribbean (excluding high income)Latin America & the Caribbean (IDA & IBRD countries)LatviaLeast developed countries: UN classificationLebanonLesothoLiberiaLibyaLithuaniaLow & middle incomeLow incomeLower middle incomeLuxembourgMacao SAR, ChinaMacedonia, FYRMadagascarMalawiMalaysiaMaldivesMaliMaltaMauritaniaMauritiusMexicoMicronesia, Fed. Sts.Middle East & North AfricaMiddle East & North Africa (excluding high income)Middle East & North Africa (IDA & IBRD countries)Middle incomeMoldovaMongoliaMontenegroMoroccoMozambiqueMyanmarNamibiaNepalNetherlandsNew CaledoniaNew ZealandNicaraguaNigerNigeriaNorth AmericaNorwayOECD membersOmanOther small statesPacific island small statesPakistanPanamaPapua New GuineaParaguayPeruPhilippinesPolandPortugalPost-demographic dividendPre-demographic dividendPuerto RicoQatarRomaniaRussian FederationRwandaSamoaSao Tome and PrincipeSaudi ArabiaSenegalSerbiaSeychellesSierra LeoneSingaporeSlovak RepublicSloveniaSmall statesSolomon IslandsSomaliaSouth AfricaSouth AsiaSouth Asia (IDA & IBRD)South SudanSpainSri LankaSt. LuciaSt. Vincent and the GrenadinesSub-Saharan Africa Sub-Saharan Africa (excluding high income)Sub-Saharan Africa (IDA & IBRD countries)SudanSurinameSwazilandSwedenSwitzerlandSyrian Arab RepublicTajikistanTanzaniaThailandTimor-LesteTogoTongaTrinidad and TobagoTunisiaTurkeyTurkmenistanUgandaUkraineUnited Arab EmiratesUnited KingdomUnited StatesUpper middle incomeUruguayUzbekistanVanuatuVenezuela, RBVietnamVirgin Islands (U.S.)West Bank and GazaWorldYemen, Rep.ZambiaZimbabwe La ligne de temps
Cette échelle de temps montre un graphique de 1961 année à 2015 année Dominican Republic. Les données jusqu'à 1960 année ne sont pas présentés. Quantité d'observations actuelles selon dates: 55.
Source (désignation):
Les indicateurs du développement mondiale
Source (organisation):
United Nations Population Division. World Population Prospects. New York, United Nations, Department of Economic and Social Affairs (advanced Excel tables). Available at http://esa.un.org/wpp/unpp/panel_population.htm.
Catégories:
Health, Gender
Dernière mise à jour
23 avr. 2017
Les indicateurs de changement de valeurs selon les années
Minimum:
51.89
1 janv. 1961
Maximum:
80.784
1 janv. 2015
Pour la date d''observation
Valeur
Changement absolu
Le changement par rapport à la valeur précédente
1 janv. 1961
51.89
+51.89
0.0%
1 janv. 1962
52.999
+1.11
2.14%
1 janv. 1963
54.109
+1.11
2.09%
1 janv. 1964
55.108
+0.999
1.85%
1 janv. 1965
56.107
+0.999
1.81%
1 janv. 1966
57.107
+0.999
1.78%
1 janv. 1967
58.106
+0.999
1.75%
1 janv. 1968
59.105
+0.999
1.72%
1 janv. 1969
59.813
+0.708
1.2%
1 janv. 1970
60.522
+0.708
1.18%
1 janv. 1971
61.23
+0.708
1.17%
1 janv. 1972
61.939
+0.708
1.16%
1 janv. 1973
62.647
+0.708
1.14%
1 janv. 1974
63.047
+0.4
0.64%
1 janv. 1975
63.448
+0.4
0.64%
1 janv. 1976
63.848
+0.4
0.63%
1 janv. 1977
64.249
+0.4
0.63%
1 janv. 1978
64.649
+0.4
0.62%
1 janv. 1979
65.129
+0.48
0.74%
1 janv. 1980
65.609
+0.48
0.74%
1 janv. 1981
66.089
+0.48
0.73%
1 janv. 1982
66.569
+0.48
0.73%
1 janv. 1983
67.049
+0.48
0.72%
1 janv. 1984
67.767
+0.718
1.07%
1 janv. 1985
68.485
+0.718
1.06%
1 janv. 1986
69.202
+0.718
1.05%
1 janv. 1987
69.92
+0.718
1.04%
1 janv. 1988
70.638
+0.718
1.03%
1 janv. 1989
71.271
+0.633
0.9%
1 janv. 1990
71.904
+0.633
0.89%
1 janv. 1991
72.536
+0.633
0.88%
1 janv. 1992
73.169
+0.633
0.87%
1 janv. 1993
73.802
+0.633
0.86%
1 janv. 1994
74.183
+0.381
0.52%
1 janv. 1995
74.565
+0.381
0.51%
1 janv. 1996
74.946
+0.381
0.51%
1 janv. 1997
75.328
+0.381
0.51%
1 janv. 1998
75.709
+0.381
0.51%
1 janv. 1999
76.072
+0.363
0.48%
1 janv. 2000
76.436
+0.363
0.48%
1 janv. 2001
76.799
+0.363
0.48%
1 janv. 2002
77.163
+0.363
0.47%
1 janv. 2003
77.526
+0.363
0.47%
1 janv. 2004
77.827
+0.301
0.39%
1 janv. 2005
78.129
+0.301
0.39%
1 janv. 2006
78.43
+0.301
0.39%
1 janv. 2007
78.732
+0.301
0.38%
1 janv. 2008
79.033
+0.301
0.38%
1 janv. 2009
79.306
+0.273
0.35%
1 janv. 2010
79.58
+0.273
0.34%
1 janv. 2011
79.853
+0.273
0.34%
1 janv. 2012
80.127
+0.273
0.34%
1 janv. 2013
80.4
+0.273
0.34%
1 janv. 2014
80.592
+0.192
0.24%
1 janv. 2015
80.784
+0.192
0.24%
Classement des pays selon les statistiques actuelles par années


Commentaires: