29
/fr/
fr
AIzaSyAYiBZKx7MnpbEhh9jyipgxe19OcubqV5w
April 1, 2024
24096
Arab World
ARB
false
2
1
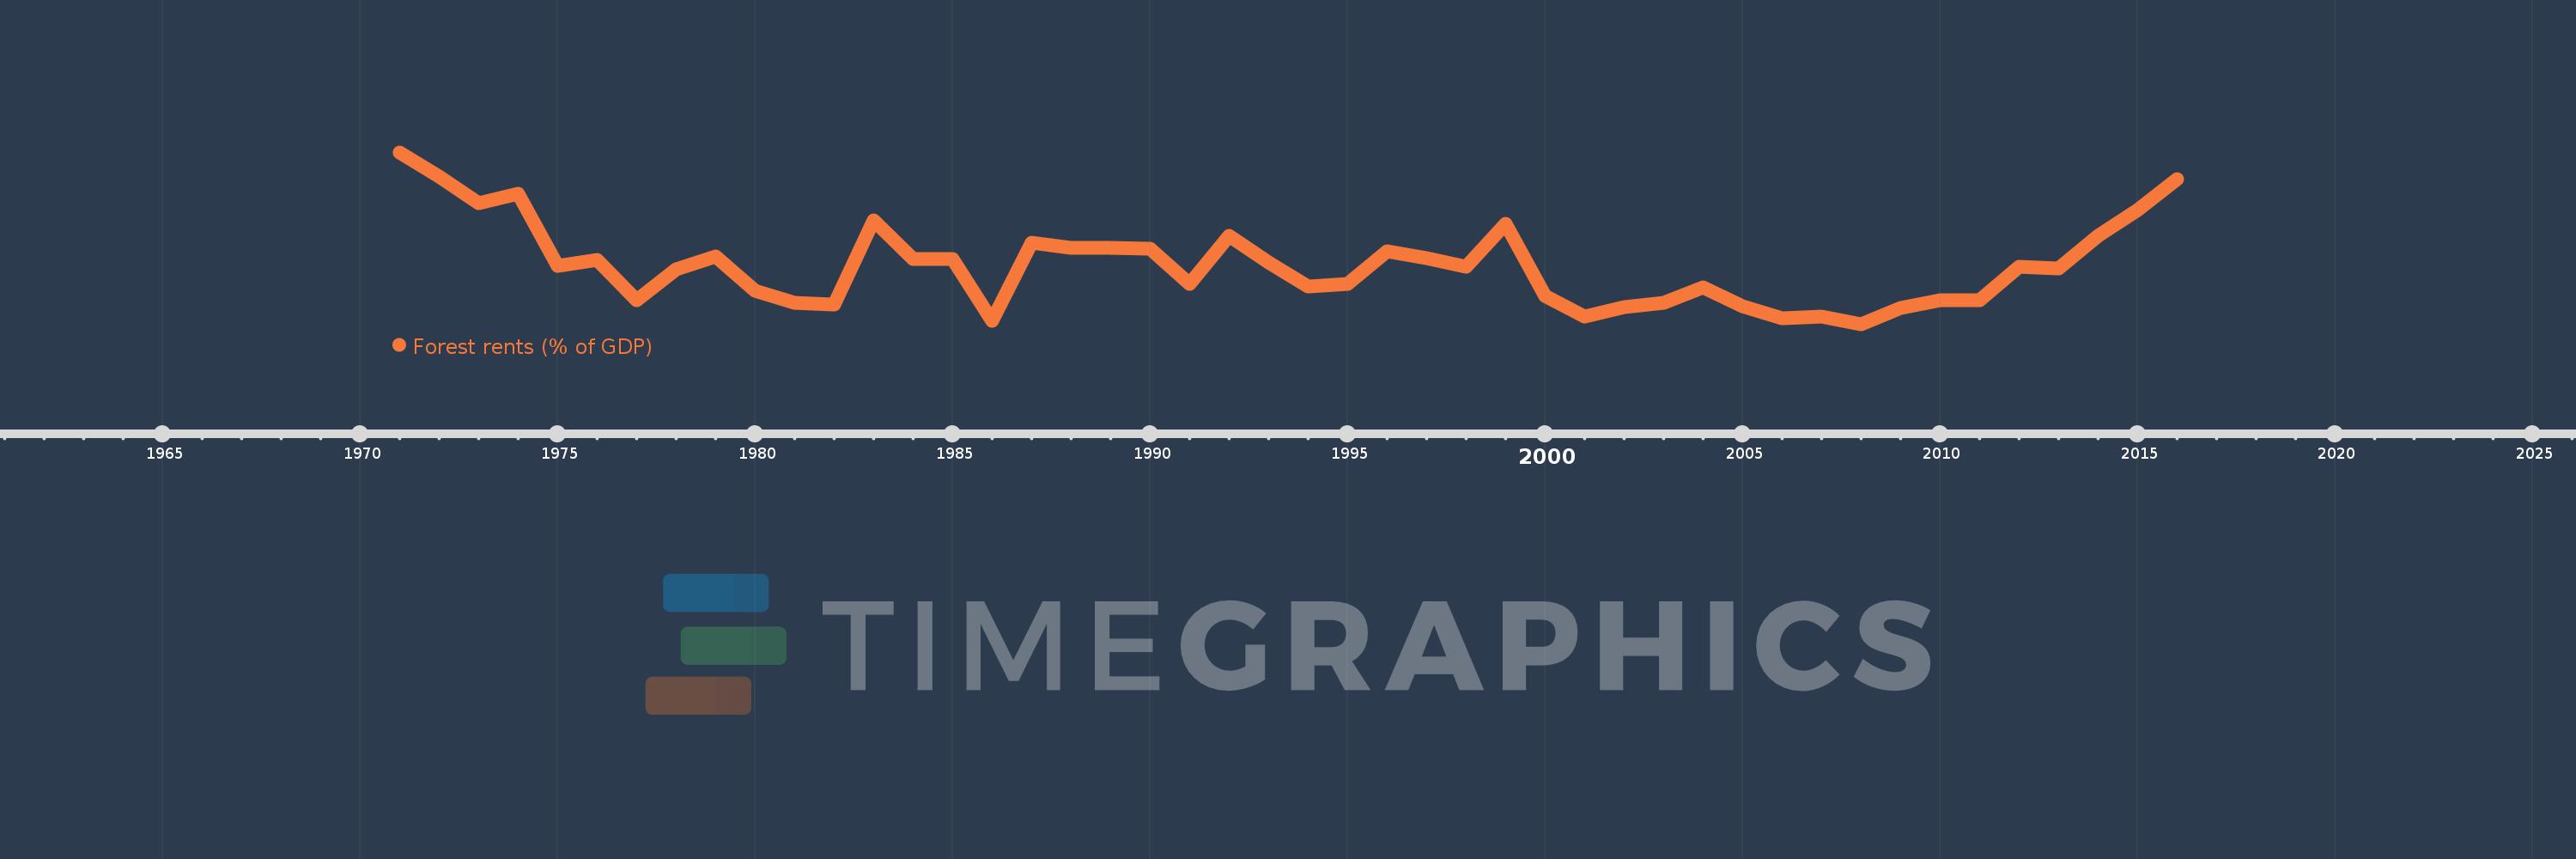
Forest rents (% of GDP)
2016,2015,2014,2013,2012,2011,2010,2009,2008,2007,2006,2005,2004,2003,2002,2001,2000,1999,1998,1997,1996,1995,1994,1993,1992,1991,1990,1989,1988,1987,1986,1985,1984,1983,1982,1981,1980,1979,1978,1977,1976,1975,1974,1973,1972,1971
Cette statistique dans les autres pays:
AfghanistanAlbaniaAlgeriaAndorraAngolaArab WorldArgentinaArmeniaArubaAustraliaAustriaAzerbaijanBahamas, TheBahrainBangladeshBarbadosBelarusBelgiumBelizeBeninBhutanBoliviaBosnia and HerzegovinaBotswanaBrazilBrunei DarussalamBulgariaBurkina FasoBurundiCabo VerdeCambodiaCameroonCanadaCaribbean small statesCentral African RepublicCentral Europe and the BalticsChadChileChinaColombiaComorosCongo, Dem. Rep.Congo, Rep.Costa RicaCote d'IvoireCroatiaCubaCyprusCzech RepublicDenmarkDjiboutiDominicaDominican RepublicEarly-demographic dividendEast Asia & PacificEast Asia & Pacific (excluding high income)East Asia & Pacific (IDA & IBRD countries)EcuadorEgypt, Arab Rep.El SalvadorEquatorial GuineaEritreaEstoniaEthiopiaEuro areaEurope & Central AsiaEurope & Central Asia (excluding high income)Europe & Central Asia (IDA & IBRD countries)European UnionFaroe IslandsFijiFinlandFragile and conflict affected situationsFranceFrench PolynesiaGabonGambia, TheGeorgiaGermanyGhanaGreeceGuatemalaGuineaGuinea-BissauGuyanaHaitiHeavily indebted poor countries (HIPC)High incomeHondurasHong Kong SAR, ChinaHungaryIBRD onlyIcelandIDA & IBRD totalIDA blendIDA onlyIDA totalIndiaIndonesiaIran, Islamic Rep.IraqIrelandIsraelItalyJamaicaJapanJordanKazakhstanKenyaKiribatiKorea, Rep.KuwaitKyrgyz RepublicLao PDRLate-demographic dividendLatin America & Caribbean Latin America & Caribbean (excluding high income)Latin America & the Caribbean (IDA & IBRD countries)LatviaLeast developed countries: UN classificationLebanonLesothoLiberiaLibyaLiechtensteinLithuaniaLow & middle incomeLow incomeLower middle incomeLuxembourgMacao SAR, ChinaMacedonia, FYRMadagascarMalawiMalaysiaMaldivesMaliMaltaMauritaniaMauritiusMexicoMicronesia, Fed. Sts.Middle East & North AfricaMiddle East & North Africa (excluding high income)Middle East & North Africa (IDA & IBRD countries)Middle incomeMoldovaMongoliaMontenegroMoroccoMozambiqueMyanmarNamibiaNepalNetherlandsNew CaledoniaNew ZealandNicaraguaNigerNigeriaNorth AmericaNorwayOECD membersOmanOther small statesPacific island small statesPakistanPanamaPapua New GuineaParaguayPeruPhilippinesPolandPortugalPost-demographic dividendPre-demographic dividendQatarRomaniaRussian FederationRwandaSamoaSao Tome and PrincipeSaudi ArabiaSenegalSerbiaSeychellesSierra LeoneSingaporeSlovak RepublicSloveniaSmall statesSolomon IslandsSomaliaSouth AfricaSouth AsiaSouth Asia (IDA & IBRD)South SudanSpainSri LankaSt. LuciaSt. Vincent and the GrenadinesSub-Saharan Africa Sub-Saharan Africa (excluding high income)Sub-Saharan Africa (IDA & IBRD countries)SudanSurinameSwazilandSwedenSwitzerlandSyrian Arab RepublicTajikistanTanzaniaThailandTimor-LesteTogoTongaTrinidad and TobagoTunisiaTurkeyTurkmenistanUgandaUkraineUnited Arab EmiratesUnited KingdomUnited StatesUpper middle incomeUruguayUzbekistanVanuatuVenezuela, RBVietnamWorldYemen, Rep.ZambiaZimbabwe La ligne de temps
Cette échelle de temps montre un graphique de 1971 année à 2016 année Arab World. Les données jusqu'à 1970 année ne sont pas présentés. Quantité d'observations actuelles selon dates: 46.
Source (désignation):
Les indicateurs du développement mondiale
Source (organisation):
Estimates based on sources and methods described in "The Changing Wealth of Nations: Measuring Sustainable Development in the New Millennium" (World Bank, 2011).
Catégories:
Environment
Dernière mise à jour
23 avr. 2017
Les indicateurs de changement de valeurs selon les années
Minimum:
0.038
1 janv. 2008
Maximum:
0.188
1 janv. 1971
Pour la date d''observation
Valeur
Changement absolu
Le changement par rapport à la valeur précédente
1 janv. 1971
0.188
+0.188
0.0%
1 janv. 1972
0.167
-0.022
-11.52%
1 janv. 1973
0.144
-0.023
-13.6%
1 janv. 1974
0.152
+0.008
5.3%
1 janv. 1975
0.089
-0.062
-41.01%
1 janv. 1976
0.094
+0.005
5.47%
1 janv. 1977
0.059
-0.035
-37.45%
1 janv. 1978
0.086
+0.027
45.49%
1 janv. 1979
0.097
+0.011
12.99%
1 janv. 1980
0.067
-0.03
-31.42%
1 janv. 1981
0.057
-0.01
-14.67%
1 janv. 1982
0.055
-0.002
-3.55%
1 janv. 1983
0.129
+0.075
136.2%
1 janv. 1984
0.095
-0.034
-26.32%
1 janv. 1985
0.095
0.0
-0.47%
1 janv. 1986
0.041
-0.053
-56.34%
1 janv. 1987
0.109
+0.068
163.14%
1 janv. 1988
0.105
-0.004
-3.97%
1 janv. 1989
0.105
+0.001
0.66%
1 janv. 1990
0.104
-0.001
-0.8%
1 janv. 1991
0.073
-0.031
-29.8%
1 janv. 1992
0.115
+0.042
56.62%
1 janv. 1993
0.092
-0.023
-19.8%
1 janv. 1994
0.071
-0.021
-22.92%
1 janv. 1995
0.073
+0.002
2.54%
1 janv. 1996
0.102
+0.029
39.95%
1 janv. 1997
0.096
-0.006
-6.11%
1 janv. 1998
0.088
-0.007
-7.62%
1 janv. 1999
0.126
+0.038
42.77%
1 janv. 2000
0.063
-0.064
-50.35%
1 janv. 2001
0.045
-0.018
-28.0%
1 janv. 2002
0.053
+0.008
18.4%
1 janv. 2003
0.057
+0.004
6.84%
1 janv. 2004
0.07
+0.013
23.31%
1 janv. 2005
0.054
-0.016
-22.64%
1 janv. 2006
0.043
-0.011
-20.68%
1 janv. 2007
0.045
+0.002
3.76%
1 janv. 2008
0.038
-0.007
-14.82%
1 janv. 2009
0.052
+0.013
35.18%
1 janv. 2010
0.059
+0.007
14.35%
1 janv. 2011
0.059
0.0
-0.69%
1 janv. 2012
0.088
+0.03
50.65%
1 janv. 2013
0.087
-0.001
-0.91%
1 janv. 2014
0.115
+0.027
31.3%
1 janv. 2015
0.138
+0.023
19.84%
1 janv. 2016
0.165
+0.028
20.16%
Classement des pays selon les statistiques actuelles par années


Commentaires: