29
/fr/
fr
AIzaSyAYiBZKx7MnpbEhh9jyipgxe19OcubqV5w
April 1, 2024
206737
Nepal
NPL
true
2
1
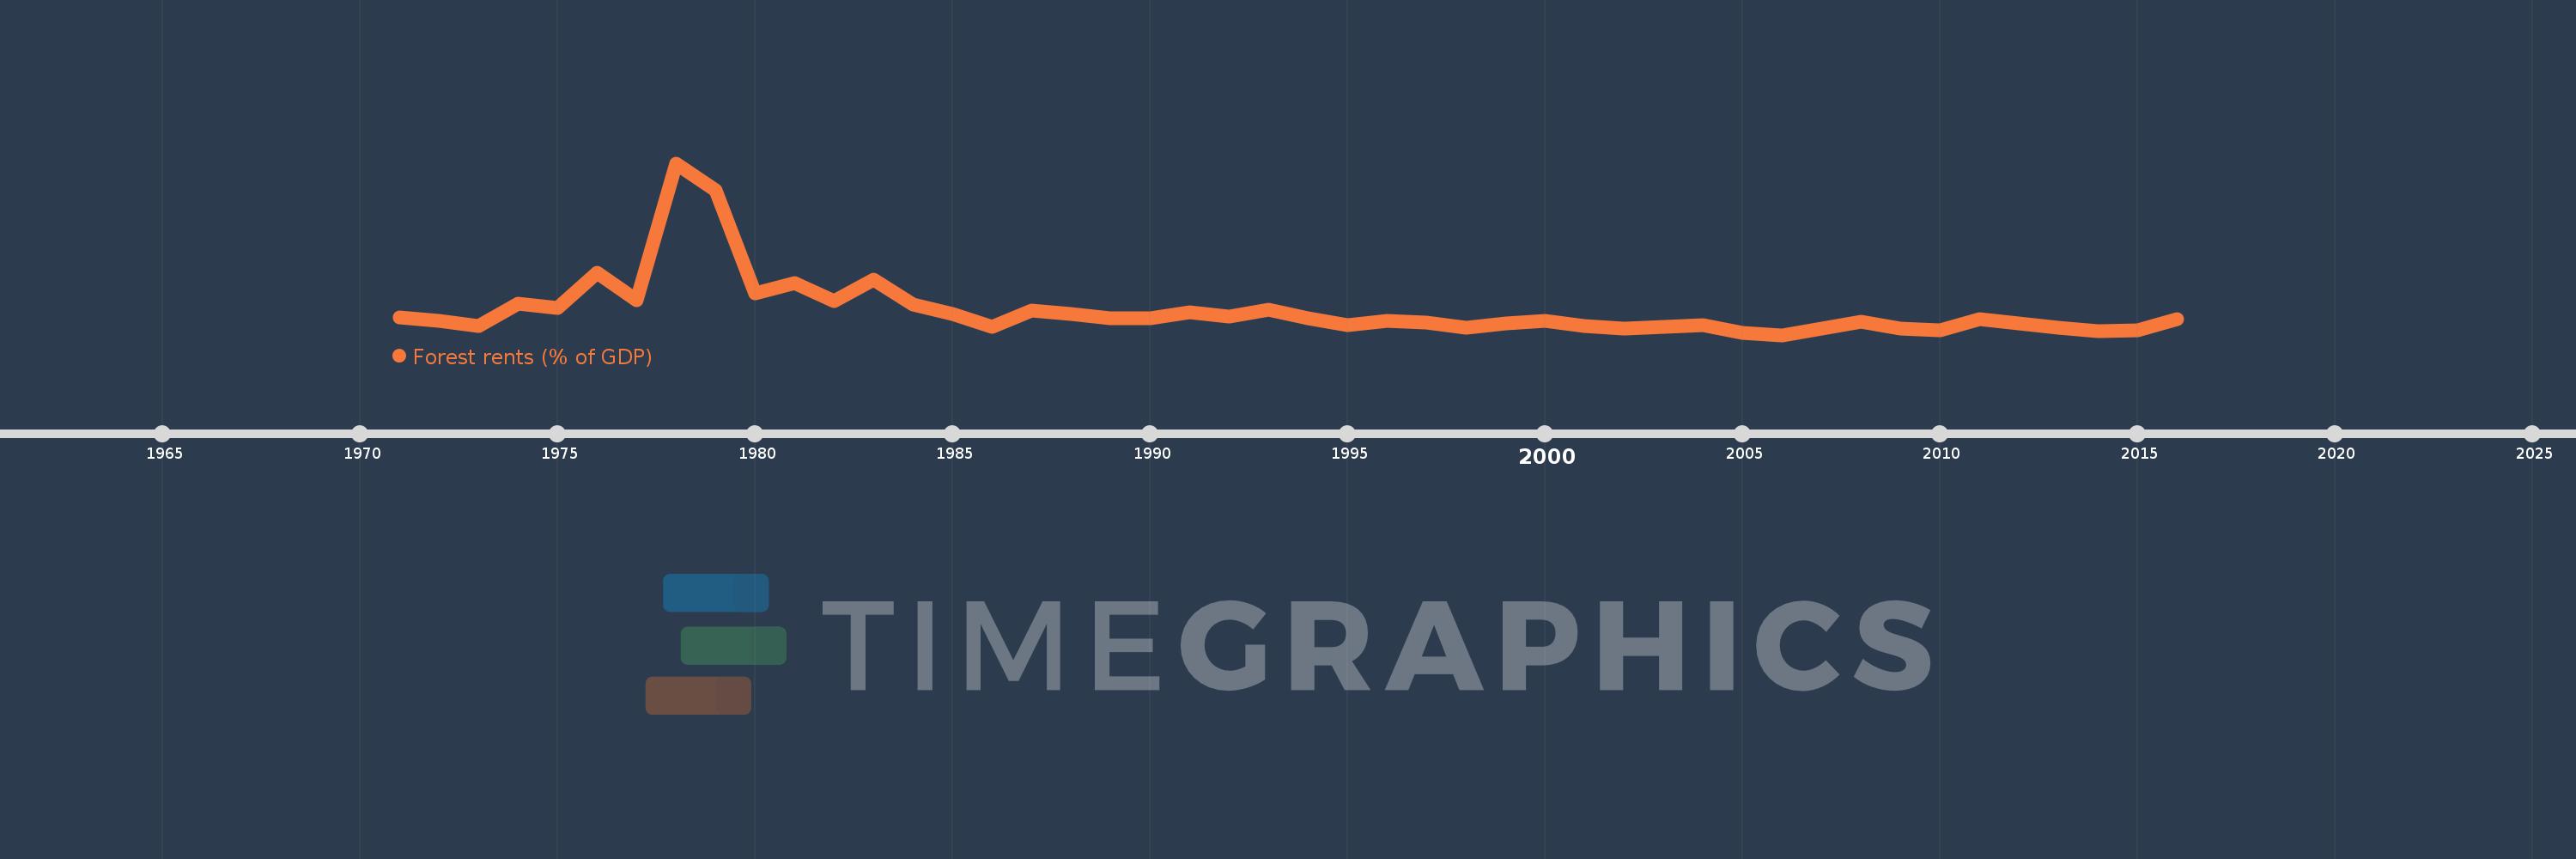
Forest rents (% of GDP)
2016,2015,2014,2013,2012,2011,2010,2009,2008,2007,2006,2005,2004,2003,2002,2001,2000,1999,1998,1997,1996,1995,1994,1993,1992,1991,1990,1989,1988,1987,1986,1985,1984,1983,1982,1981,1980,1979,1978,1977,1976,1975,1974,1973,1972,1971
Cette statistique dans les autres pays:
AfghanistanAlbaniaAlgeriaAndorraAngolaArab WorldArgentinaArmeniaArubaAustraliaAustriaAzerbaijanBahamas, TheBahrainBangladeshBarbadosBelarusBelgiumBelizeBeninBhutanBoliviaBosnia and HerzegovinaBotswanaBrazilBrunei DarussalamBulgariaBurkina FasoBurundiCabo VerdeCambodiaCameroonCanadaCaribbean small statesCentral African RepublicCentral Europe and the BalticsChadChileChinaColombiaComorosCongo, Dem. Rep.Congo, Rep.Costa RicaCote d'IvoireCroatiaCubaCyprusCzech RepublicDenmarkDjiboutiDominicaDominican RepublicEarly-demographic dividendEast Asia & PacificEast Asia & Pacific (excluding high income)East Asia & Pacific (IDA & IBRD countries)EcuadorEgypt, Arab Rep.El SalvadorEquatorial GuineaEritreaEstoniaEthiopiaEuro areaEurope & Central AsiaEurope & Central Asia (excluding high income)Europe & Central Asia (IDA & IBRD countries)European UnionFaroe IslandsFijiFinlandFragile and conflict affected situationsFranceFrench PolynesiaGabonGambia, TheGeorgiaGermanyGhanaGreeceGuatemalaGuineaGuinea-BissauGuyanaHaitiHeavily indebted poor countries (HIPC)High incomeHondurasHong Kong SAR, ChinaHungaryIBRD onlyIcelandIDA & IBRD totalIDA blendIDA onlyIDA totalIndiaIndonesiaIran, Islamic Rep.IraqIrelandIsraelItalyJamaicaJapanJordanKazakhstanKenyaKiribatiKorea, Rep.KuwaitKyrgyz RepublicLao PDRLate-demographic dividendLatin America & Caribbean Latin America & Caribbean (excluding high income)Latin America & the Caribbean (IDA & IBRD countries)LatviaLeast developed countries: UN classificationLebanonLesothoLiberiaLibyaLiechtensteinLithuaniaLow & middle incomeLow incomeLower middle incomeLuxembourgMacao SAR, ChinaMacedonia, FYRMadagascarMalawiMalaysiaMaldivesMaliMaltaMauritaniaMauritiusMexicoMicronesia, Fed. Sts.Middle East & North AfricaMiddle East & North Africa (excluding high income)Middle East & North Africa (IDA & IBRD countries)Middle incomeMoldovaMongoliaMontenegroMoroccoMozambiqueMyanmarNamibiaNepalNetherlandsNew CaledoniaNew ZealandNicaraguaNigerNigeriaNorth AmericaNorwayOECD membersOmanOther small statesPacific island small statesPakistanPanamaPapua New GuineaParaguayPeruPhilippinesPolandPortugalPost-demographic dividendPre-demographic dividendQatarRomaniaRussian FederationRwandaSamoaSao Tome and PrincipeSaudi ArabiaSenegalSerbiaSeychellesSierra LeoneSingaporeSlovak RepublicSloveniaSmall statesSolomon IslandsSomaliaSouth AfricaSouth AsiaSouth Asia (IDA & IBRD)South SudanSpainSri LankaSt. LuciaSt. Vincent and the GrenadinesSub-Saharan Africa Sub-Saharan Africa (excluding high income)Sub-Saharan Africa (IDA & IBRD countries)SudanSurinameSwazilandSwedenSwitzerlandSyrian Arab RepublicTajikistanTanzaniaThailandTimor-LesteTogoTongaTrinidad and TobagoTunisiaTurkeyTurkmenistanUgandaUkraineUnited Arab EmiratesUnited KingdomUnited StatesUpper middle incomeUruguayUzbekistanVanuatuVenezuela, RBVietnamWorldYemen, Rep.ZambiaZimbabwe La ligne de temps
Cette échelle de temps montre un graphique de 1971 année à 2016 année Nepal. Les données jusqu'à 1970 année ne sont pas présentés. Quantité d'observations actuelles selon dates: 46.
Source (désignation):
Les indicateurs du développement mondiale
Source (organisation):
Estimates based on sources and methods described in "The Changing Wealth of Nations: Measuring Sustainable Development in the New Millennium" (World Bank, 2011).
Catégories:
Environment
Dernière mise à jour
23 avr. 2017
Les indicateurs de changement de valeurs selon les années
Minimum:
0.788
1 janv. 2006
Maximum:
8.138
1 janv. 1978
Pour la date d''observation
Valeur
Changement absolu
Le changement par rapport à la valeur précédente
1 janv. 1971
1.547
+1.547
0.0%
1 janv. 1972
1.402
-0.145
-9.37%
1 janv. 1973
1.175
-0.227
-16.21%
1 janv. 1974
2.113
+0.938
79.86%
1 janv. 1975
1.945
-0.168
-7.95%
1 janv. 1976
3.436
+1.491
76.64%
1 janv. 1977
2.286
-1.15
-33.48%
1 janv. 1978
8.138
+5.852
256.04%
1 janv. 1979
6.974
-1.164
-14.31%
1 janv. 1980
2.571
-4.402
-63.13%
1 janv. 1981
2.997
+0.426
16.58%
1 janv. 1982
2.242
-0.755
-25.2%
1 janv. 1983
3.152
+0.91
40.58%
1 janv. 1984
2.088
-1.064
-33.76%
1 janv. 1985
1.672
-0.416
-19.9%
1 janv. 1986
1.152
-0.52
-31.08%
1 janv. 1987
1.846
+0.694
60.21%
1 janv. 1988
1.68
-0.166
-9.0%
1 janv. 1989
1.522
-0.158
-9.43%
1 janv. 1990
1.489
-0.033
-2.17%
1 janv. 1991
1.747
+0.258
17.33%
1 janv. 1992
1.596
-0.151
-8.62%
1 janv. 1993
1.887
+0.291
18.24%
1 janv. 1994
1.523
-0.364
-19.28%
1 janv. 1995
1.2
-0.323
-21.23%
1 janv. 1996
1.389
+0.189
15.73%
1 janv. 1997
1.326
-0.063
-4.5%
1 janv. 1998
1.091
-0.236
-17.76%
1 janv. 1999
1.272
+0.181
16.6%
1 janv. 2000
1.395
+0.123
9.68%
1 janv. 2001
1.163
-0.231
-16.59%
1 janv. 2002
1.058
-0.106
-9.1%
1 janv. 2003
1.139
+0.082
7.72%
1 janv. 2004
1.208
+0.069
6.01%
1 janv. 2005
0.897
-0.311
-25.76%
1 janv. 2006
0.788
-0.109
-12.13%
1 janv. 2007
1.074
+0.286
36.32%
1 janv. 2008
1.35
+0.276
25.67%
1 janv. 2009
1.062
-0.288
-21.31%
1 janv. 2010
0.999
-0.063
-5.89%
1 janv. 2011
1.464
+0.465
46.53%
1 janv. 2012
1.269
-0.195
-13.35%
1 janv. 2013
1.084
-0.185
-14.62%
1 janv. 2014
0.95
-0.134
-12.33%
1 janv. 2015
0.973
+0.023
2.43%
1 janv. 2016
1.464
+0.491
50.46%
Classement des pays selon les statistiques actuelles par années


Commentaires: