29
/fr/
fr
AIzaSyAYiBZKx7MnpbEhh9jyipgxe19OcubqV5w
April 1, 2024
185166
Madagascar
MDG
true
2
1
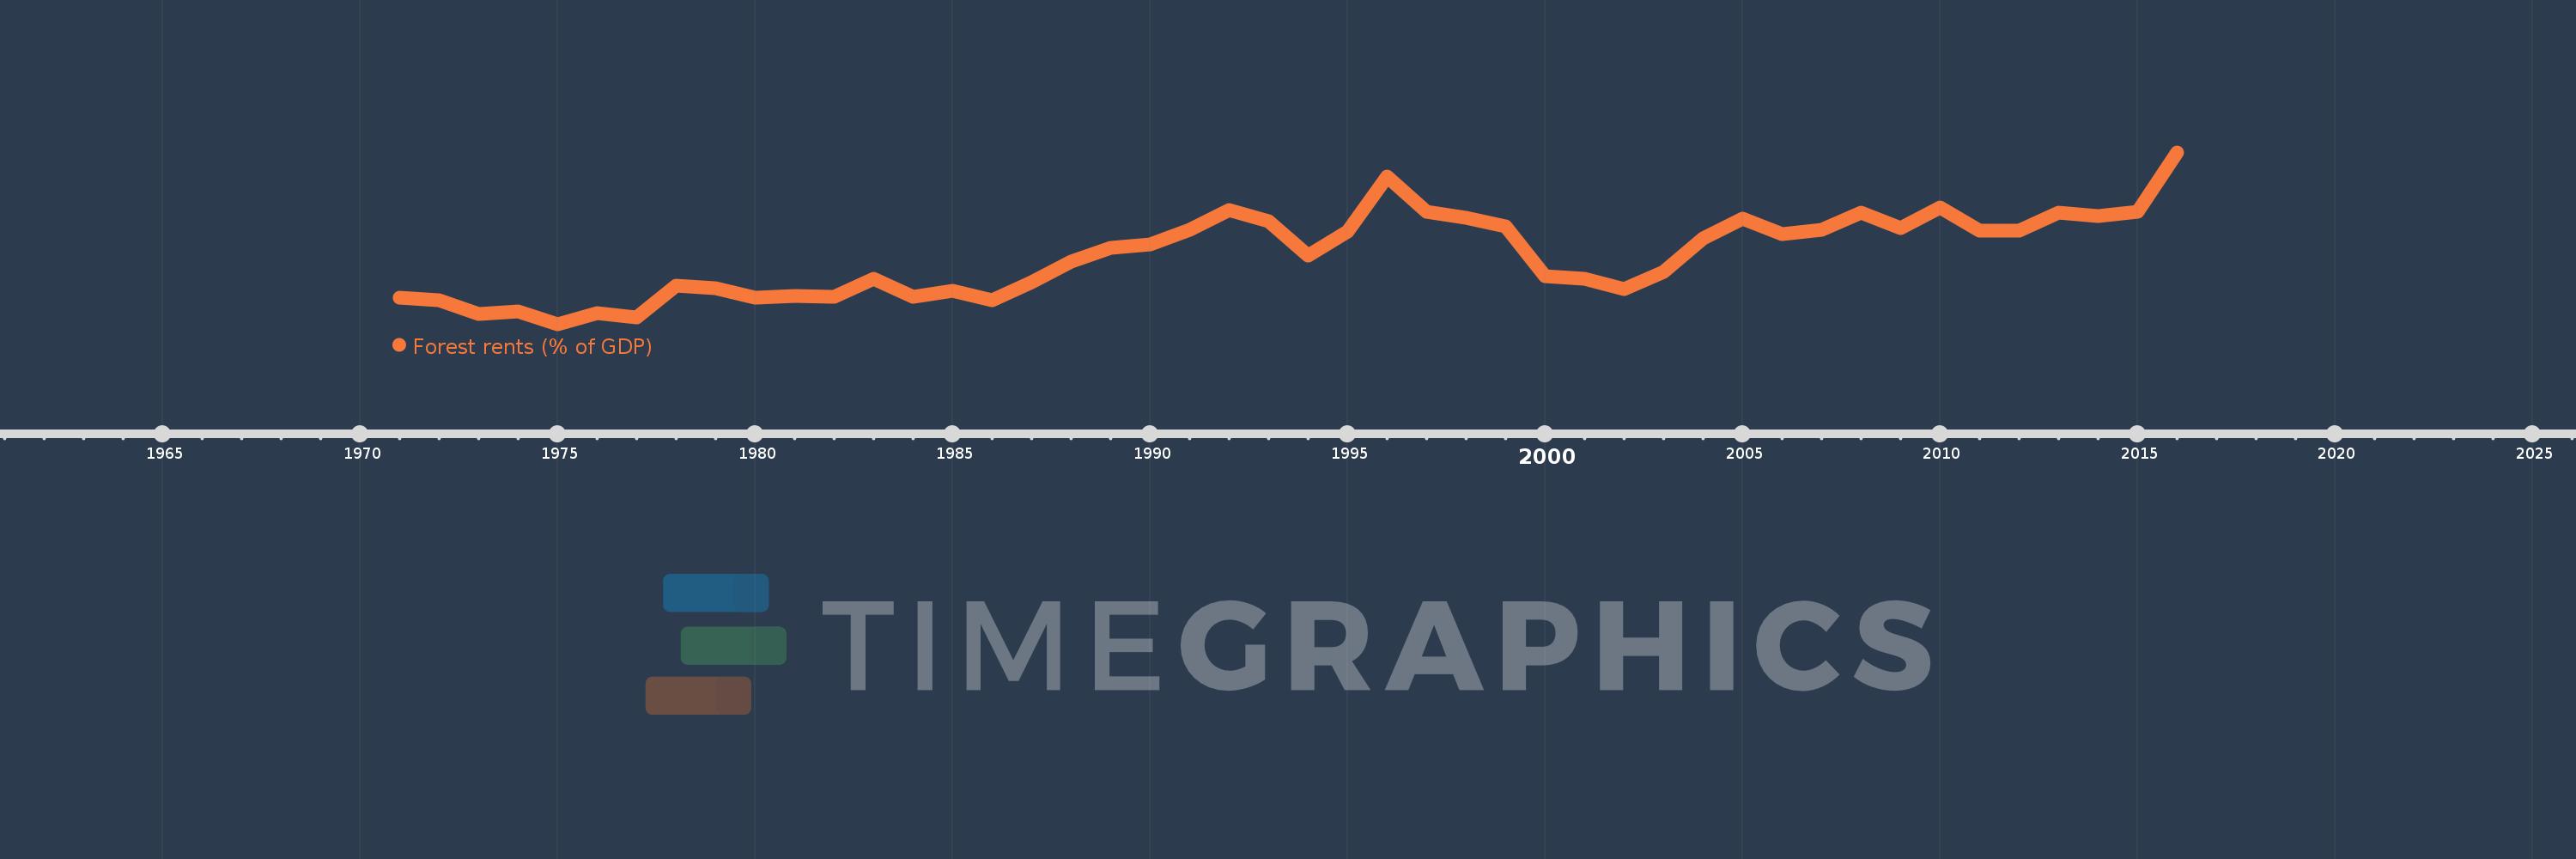
Forest rents (% of GDP)
2016,2015,2014,2013,2012,2011,2010,2009,2008,2007,2006,2005,2004,2003,2002,2001,2000,1999,1998,1997,1996,1995,1994,1993,1992,1991,1990,1989,1988,1987,1986,1985,1984,1983,1982,1981,1980,1979,1978,1977,1976,1975,1974,1973,1972,1971
Cette statistique dans les autres pays:
AfghanistanAlbaniaAlgeriaAndorraAngolaArab WorldArgentinaArmeniaArubaAustraliaAustriaAzerbaijanBahamas, TheBahrainBangladeshBarbadosBelarusBelgiumBelizeBeninBhutanBoliviaBosnia and HerzegovinaBotswanaBrazilBrunei DarussalamBulgariaBurkina FasoBurundiCabo VerdeCambodiaCameroonCanadaCaribbean small statesCentral African RepublicCentral Europe and the BalticsChadChileChinaColombiaComorosCongo, Dem. Rep.Congo, Rep.Costa RicaCote d'IvoireCroatiaCubaCyprusCzech RepublicDenmarkDjiboutiDominicaDominican RepublicEarly-demographic dividendEast Asia & PacificEast Asia & Pacific (excluding high income)East Asia & Pacific (IDA & IBRD countries)EcuadorEgypt, Arab Rep.El SalvadorEquatorial GuineaEritreaEstoniaEthiopiaEuro areaEurope & Central AsiaEurope & Central Asia (excluding high income)Europe & Central Asia (IDA & IBRD countries)European UnionFaroe IslandsFijiFinlandFragile and conflict affected situationsFranceFrench PolynesiaGabonGambia, TheGeorgiaGermanyGhanaGreeceGuatemalaGuineaGuinea-BissauGuyanaHaitiHeavily indebted poor countries (HIPC)High incomeHondurasHong Kong SAR, ChinaHungaryIBRD onlyIcelandIDA & IBRD totalIDA blendIDA onlyIDA totalIndiaIndonesiaIran, Islamic Rep.IraqIrelandIsraelItalyJamaicaJapanJordanKazakhstanKenyaKiribatiKorea, Rep.KuwaitKyrgyz RepublicLao PDRLate-demographic dividendLatin America & Caribbean Latin America & Caribbean (excluding high income)Latin America & the Caribbean (IDA & IBRD countries)LatviaLeast developed countries: UN classificationLebanonLesothoLiberiaLibyaLiechtensteinLithuaniaLow & middle incomeLow incomeLower middle incomeLuxembourgMacao SAR, ChinaMacedonia, FYRMadagascarMalawiMalaysiaMaldivesMaliMaltaMauritaniaMauritiusMexicoMicronesia, Fed. Sts.Middle East & North AfricaMiddle East & North Africa (excluding high income)Middle East & North Africa (IDA & IBRD countries)Middle incomeMoldovaMongoliaMontenegroMoroccoMozambiqueMyanmarNamibiaNepalNetherlandsNew CaledoniaNew ZealandNicaraguaNigerNigeriaNorth AmericaNorwayOECD membersOmanOther small statesPacific island small statesPakistanPanamaPapua New GuineaParaguayPeruPhilippinesPolandPortugalPost-demographic dividendPre-demographic dividendQatarRomaniaRussian FederationRwandaSamoaSao Tome and PrincipeSaudi ArabiaSenegalSerbiaSeychellesSierra LeoneSingaporeSlovak RepublicSloveniaSmall statesSolomon IslandsSomaliaSouth AfricaSouth AsiaSouth Asia (IDA & IBRD)South SudanSpainSri LankaSt. LuciaSt. Vincent and the GrenadinesSub-Saharan Africa Sub-Saharan Africa (excluding high income)Sub-Saharan Africa (IDA & IBRD countries)SudanSurinameSwazilandSwedenSwitzerlandSyrian Arab RepublicTajikistanTanzaniaThailandTimor-LesteTogoTongaTrinidad and TobagoTunisiaTurkeyTurkmenistanUgandaUkraineUnited Arab EmiratesUnited KingdomUnited StatesUpper middle incomeUruguayUzbekistanVanuatuVenezuela, RBVietnamWorldYemen, Rep.ZambiaZimbabwe La ligne de temps
Cette échelle de temps montre un graphique de 1971 année à 2016 année Madagascar. Les données jusqu'à 1970 année ne sont pas présentés. Quantité d'observations actuelles selon dates: 46.
Source (désignation):
Les indicateurs du développement mondiale
Source (organisation):
Estimates based on sources and methods described in "The Changing Wealth of Nations: Measuring Sustainable Development in the New Millennium" (World Bank, 2011).
Catégories:
Environment
Dernière mise à jour
23 avr. 2017
Les indicateurs de changement de valeurs selon les années
Minimum:
1.474
1 janv. 1975
Maximum:
10.692
1 janv. 2016
Pour la date d''observation
Valeur
Changement absolu
Le changement par rapport à la valeur précédente
1 janv. 1971
2.919
+2.919
0.0%
1 janv. 1972
2.757
-0.162
-5.55%
1 janv. 1973
2.02
-0.737
-26.74%
1 janv. 1974
2.172
+0.152
7.55%
1 janv. 1975
1.474
-0.698
-32.13%
1 janv. 1976
2.049
+0.574
38.96%
1 janv. 1977
1.825
-0.224
-10.92%
1 janv. 1978
3.55
+1.725
94.52%
1 janv. 1979
3.41
-0.14
-3.94%
1 janv. 1980
2.88
-0.531
-15.56%
1 janv. 1981
2.973
+0.094
3.25%
1 janv. 1982
2.93
-0.043
-1.46%
1 janv. 1983
3.928
+0.998
34.07%
1 janv. 1984
2.929
-0.999
-25.42%
1 janv. 1985
3.245
+0.315
10.77%
1 janv. 1986
2.778
-0.467
-14.4%
1 janv. 1987
3.737
+0.959
34.54%
1 janv. 1988
4.82
+1.083
28.97%
1 janv. 1989
5.55
+0.73
15.15%
1 janv. 1990
5.751
+0.201
3.62%
1 janv. 1991
6.551
+0.8
13.92%
1 janv. 1992
7.605
+1.054
16.09%
1 janv. 1993
7.007
-0.598
-7.86%
1 janv. 1994
5.145
-1.862
-26.58%
1 janv. 1995
6.429
+1.284
24.96%
1 janv. 1996
9.378
+2.949
45.86%
1 janv. 1997
7.527
-1.85
-19.73%
1 janv. 1998
7.194
-0.334
-4.43%
1 janv. 1999
6.728
-0.466
-6.47%
1 janv. 2000
4.04
-2.688
-39.95%
1 janv. 2001
3.919
-0.121
-2.99%
1 janv. 2002
3.346
-0.573
-14.63%
1 janv. 2003
4.265
+0.92
27.48%
1 janv. 2004
6.075
+1.81
42.43%
1 janv. 2005
7.149
+1.074
17.67%
1 janv. 2006
6.291
-0.858
-12.01%
1 janv. 2007
6.518
+0.228
3.62%
1 janv. 2008
7.469
+0.951
14.58%
1 janv. 2009
6.615
-0.854
-11.43%
1 janv. 2010
7.735
+1.121
16.94%
1 janv. 2011
6.504
-1.232
-15.92%
1 janv. 2012
6.51
+0.006
0.09%
1 janv. 2013
7.46
+0.95
14.59%
1 janv. 2014
7.288
-0.171
-2.3%
1 janv. 2015
7.505
+0.217
2.98%
1 janv. 2016
10.692
+3.186
42.45%
Classement des pays selon les statistiques actuelles par années


Commentaires: