29
/fr/
fr
AIzaSyAYiBZKx7MnpbEhh9jyipgxe19OcubqV5w
April 1, 2024
219566
Papua New Guinea
PNG
true
2
1
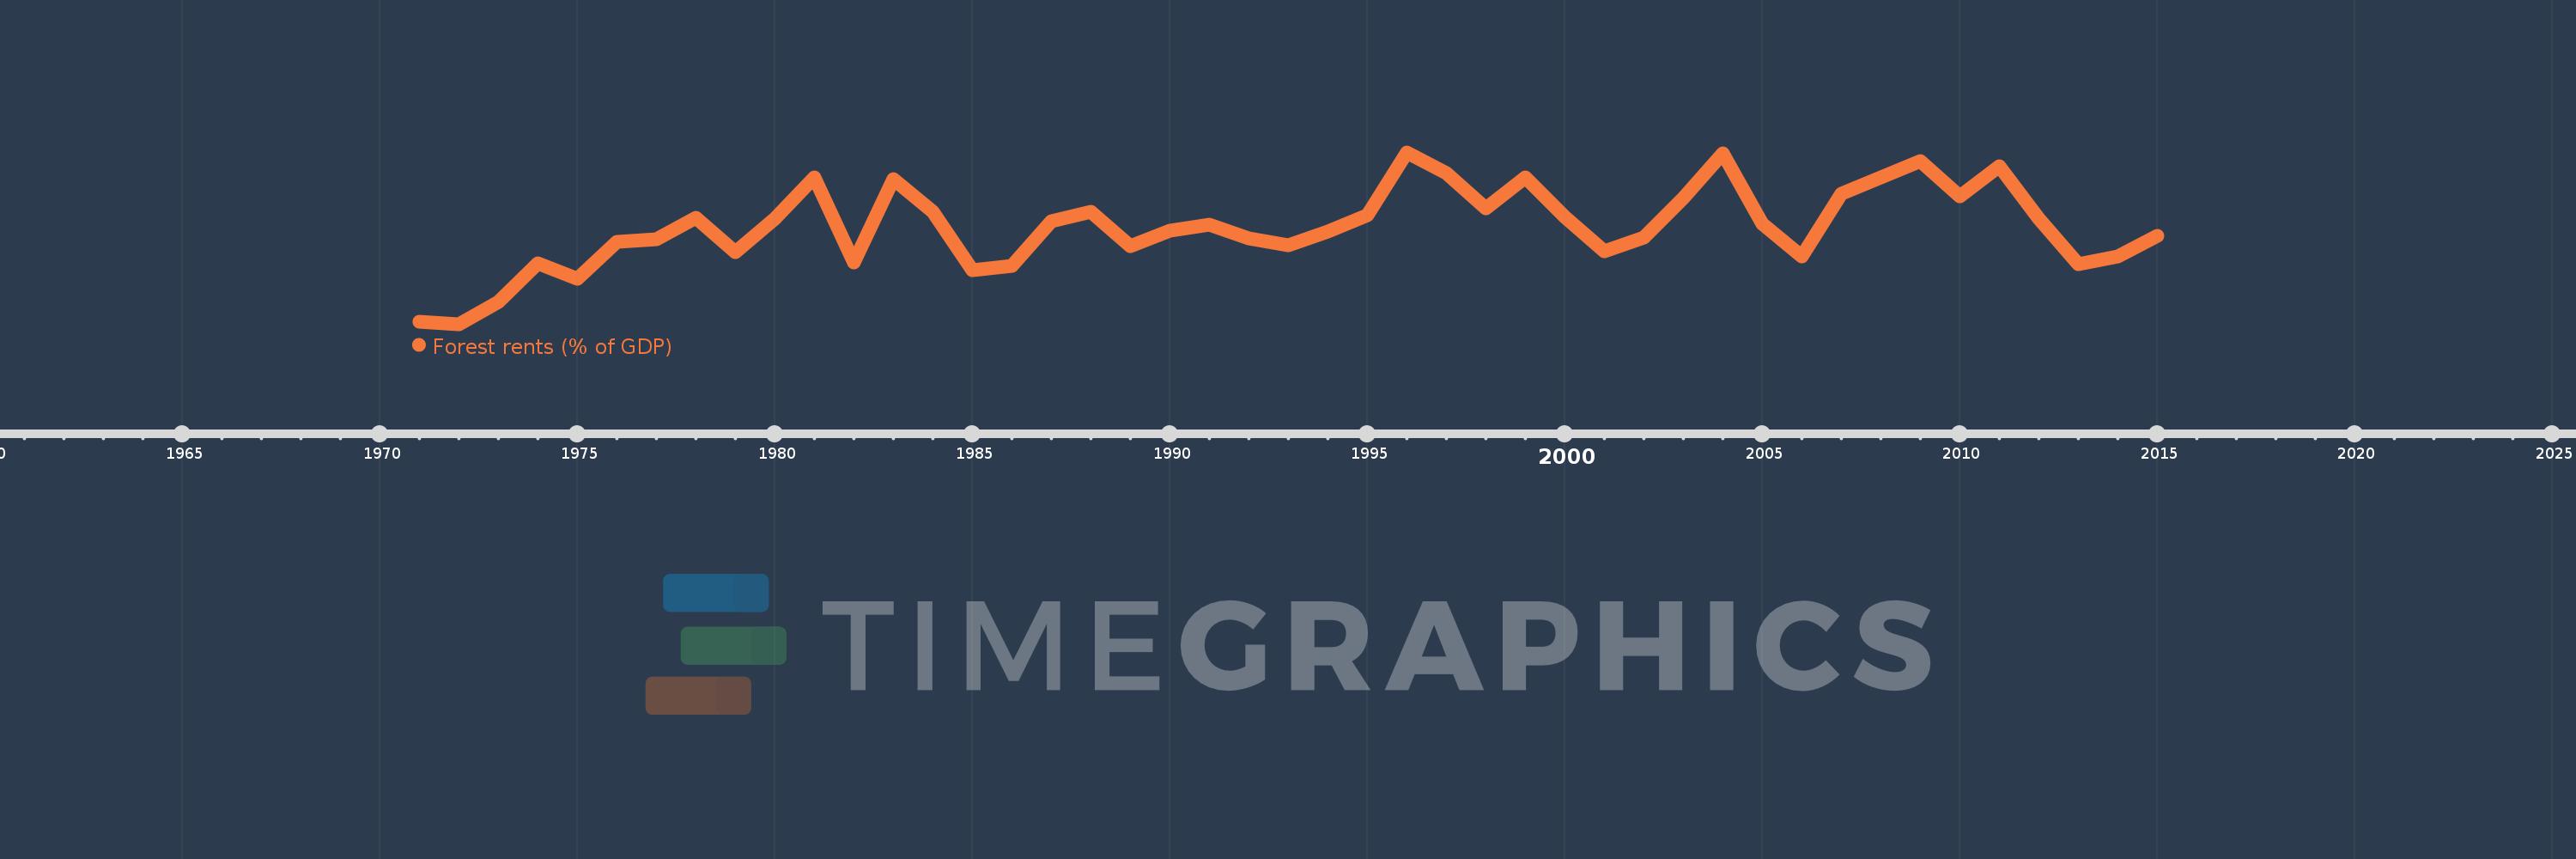
Forest rents (% of GDP)
2015,2014,2013,2012,2011,2010,2009,2008,2007,2006,2005,2004,2003,2002,2001,2000,1999,1998,1997,1996,1995,1994,1993,1992,1991,1990,1989,1988,1987,1986,1985,1984,1983,1982,1981,1980,1979,1978,1977,1976,1975,1974,1973,1972,1971
Cette statistique dans les autres pays:
AfghanistanAlbaniaAlgeriaAndorraAngolaArab WorldArgentinaArmeniaArubaAustraliaAustriaAzerbaijanBahamas, TheBahrainBangladeshBarbadosBelarusBelgiumBelizeBeninBhutanBoliviaBosnia and HerzegovinaBotswanaBrazilBrunei DarussalamBulgariaBurkina FasoBurundiCabo VerdeCambodiaCameroonCanadaCaribbean small statesCentral African RepublicCentral Europe and the BalticsChadChileChinaColombiaComorosCongo, Dem. Rep.Congo, Rep.Costa RicaCote d'IvoireCroatiaCubaCyprusCzech RepublicDenmarkDjiboutiDominicaDominican RepublicEarly-demographic dividendEast Asia & PacificEast Asia & Pacific (excluding high income)East Asia & Pacific (IDA & IBRD countries)EcuadorEgypt, Arab Rep.El SalvadorEquatorial GuineaEritreaEstoniaEthiopiaEuro areaEurope & Central AsiaEurope & Central Asia (excluding high income)Europe & Central Asia (IDA & IBRD countries)European UnionFaroe IslandsFijiFinlandFragile and conflict affected situationsFranceFrench PolynesiaGabonGambia, TheGeorgiaGermanyGhanaGreeceGuatemalaGuineaGuinea-BissauGuyanaHaitiHeavily indebted poor countries (HIPC)High incomeHondurasHong Kong SAR, ChinaHungaryIBRD onlyIcelandIDA & IBRD totalIDA blendIDA onlyIDA totalIndiaIndonesiaIran, Islamic Rep.IraqIrelandIsraelItalyJamaicaJapanJordanKazakhstanKenyaKiribatiKorea, Rep.KuwaitKyrgyz RepublicLao PDRLate-demographic dividendLatin America & Caribbean Latin America & Caribbean (excluding high income)Latin America & the Caribbean (IDA & IBRD countries)LatviaLeast developed countries: UN classificationLebanonLesothoLiberiaLibyaLiechtensteinLithuaniaLow & middle incomeLow incomeLower middle incomeLuxembourgMacao SAR, ChinaMacedonia, FYRMadagascarMalawiMalaysiaMaldivesMaliMaltaMauritaniaMauritiusMexicoMicronesia, Fed. Sts.Middle East & North AfricaMiddle East & North Africa (excluding high income)Middle East & North Africa (IDA & IBRD countries)Middle incomeMoldovaMongoliaMontenegroMoroccoMozambiqueMyanmarNamibiaNepalNetherlandsNew CaledoniaNew ZealandNicaraguaNigerNigeriaNorth AmericaNorwayOECD membersOmanOther small statesPacific island small statesPakistanPanamaPapua New GuineaParaguayPeruPhilippinesPolandPortugalPost-demographic dividendPre-demographic dividendQatarRomaniaRussian FederationRwandaSamoaSao Tome and PrincipeSaudi ArabiaSenegalSerbiaSeychellesSierra LeoneSingaporeSlovak RepublicSloveniaSmall statesSolomon IslandsSomaliaSouth AfricaSouth AsiaSouth Asia (IDA & IBRD)South SudanSpainSri LankaSt. LuciaSt. Vincent and the GrenadinesSub-Saharan Africa Sub-Saharan Africa (excluding high income)Sub-Saharan Africa (IDA & IBRD countries)SudanSurinameSwazilandSwedenSwitzerlandSyrian Arab RepublicTajikistanTanzaniaThailandTimor-LesteTogoTongaTrinidad and TobagoTunisiaTurkeyTurkmenistanUgandaUkraineUnited Arab EmiratesUnited KingdomUnited StatesUpper middle incomeUruguayUzbekistanVanuatuVenezuela, RBVietnamWorldYemen, Rep.ZambiaZimbabwe La ligne de temps
Cette échelle de temps montre un graphique de 1971 année à 2015 année Papua New Guinea. Les données jusqu'à 1970 année ne sont pas présentés. Quantité d'observations actuelles selon dates: 45.
Source (désignation):
Les indicateurs du développement mondiale
Source (organisation):
Estimates based on sources and methods described in "The Changing Wealth of Nations: Measuring Sustainable Development in the New Millennium" (World Bank, 2011).
Catégories:
Environment
Dernière mise à jour
23 avr. 2017
Les indicateurs de changement de valeurs selon les années
Minimum:
1.845
1 janv. 1972
Maximum:
6.015
1 janv. 1996
Pour la date d''observation
Valeur
Changement absolu
Le changement par rapport à la valeur précédente
1 janv. 1971
1.908
+1.908
0.0%
1 janv. 1972
1.845
-0.063
-3.29%
1 janv. 1973
2.393
+0.548
29.68%
1 janv. 1974
3.328
+0.935
39.06%
1 janv. 1975
2.956
-0.372
-11.18%
1 janv. 1976
3.838
+0.883
29.86%
1 janv. 1977
3.899
+0.061
1.58%
1 janv. 1978
4.435
+0.536
13.74%
1 janv. 1979
3.594
-0.84
-18.95%
1 janv. 1980
4.411
+0.817
22.73%
1 janv. 1981
5.405
+0.993
22.52%
1 janv. 1982
3.335
-2.07
-38.3%
1 janv. 1983
5.358
+2.023
60.67%
1 janv. 1984
4.57
-0.788
-14.71%
1 janv. 1985
3.155
-1.415
-30.97%
1 janv. 1986
3.269
+0.114
3.63%
1 janv. 1987
4.341
+1.072
32.79%
1 janv. 1988
4.584
+0.243
5.6%
1 janv. 1989
3.733
-0.851
-18.56%
1 janv. 1990
4.115
+0.382
10.22%
1 janv. 1991
4.257
+0.143
3.47%
1 janv. 1992
3.93
-0.327
-7.68%
1 janv. 1993
3.771
-0.159
-4.05%
1 janv. 1994
4.089
+0.318
8.44%
1 janv. 1995
4.488
+0.399
9.76%
1 janv. 1996
6.015
+1.527
34.02%
1 janv. 1997
5.506
-0.509
-8.47%
1 janv. 1998
4.656
-0.85
-15.44%
1 janv. 1999
5.41
+0.754
16.2%
1 janv. 2000
4.441
-0.969
-17.9%
1 janv. 2001
3.619
-0.822
-18.52%
1 janv. 2002
3.939
+0.321
8.86%
1 janv. 2003
4.918
+0.978
24.84%
1 janv. 2004
5.995
+1.077
21.89%
1 janv. 2005
4.275
-1.719
-28.68%
1 janv. 2006
3.498
-0.777
-18.18%
1 janv. 2007
5.002
+1.504
42.99%
1 janv. 2008
5.413
+0.411
8.21%
1 janv. 2009
5.807
+0.394
7.29%
1 janv. 2010
4.955
-0.852
-14.67%
1 janv. 2011
5.679
+0.723
14.6%
1 janv. 2012
4.406
-1.273
-22.42%
1 janv. 2013
3.312
-1.094
-24.83%
1 janv. 2014
3.489
+0.177
5.35%
1 janv. 2015
3.992
+0.503
14.41%
Classement des pays selon les statistiques actuelles par années


Commentaires: