29
/fr/
fr
AIzaSyAYiBZKx7MnpbEhh9jyipgxe19OcubqV5w
April 1, 2024
185889
Madagascar
MDG
true
2
1
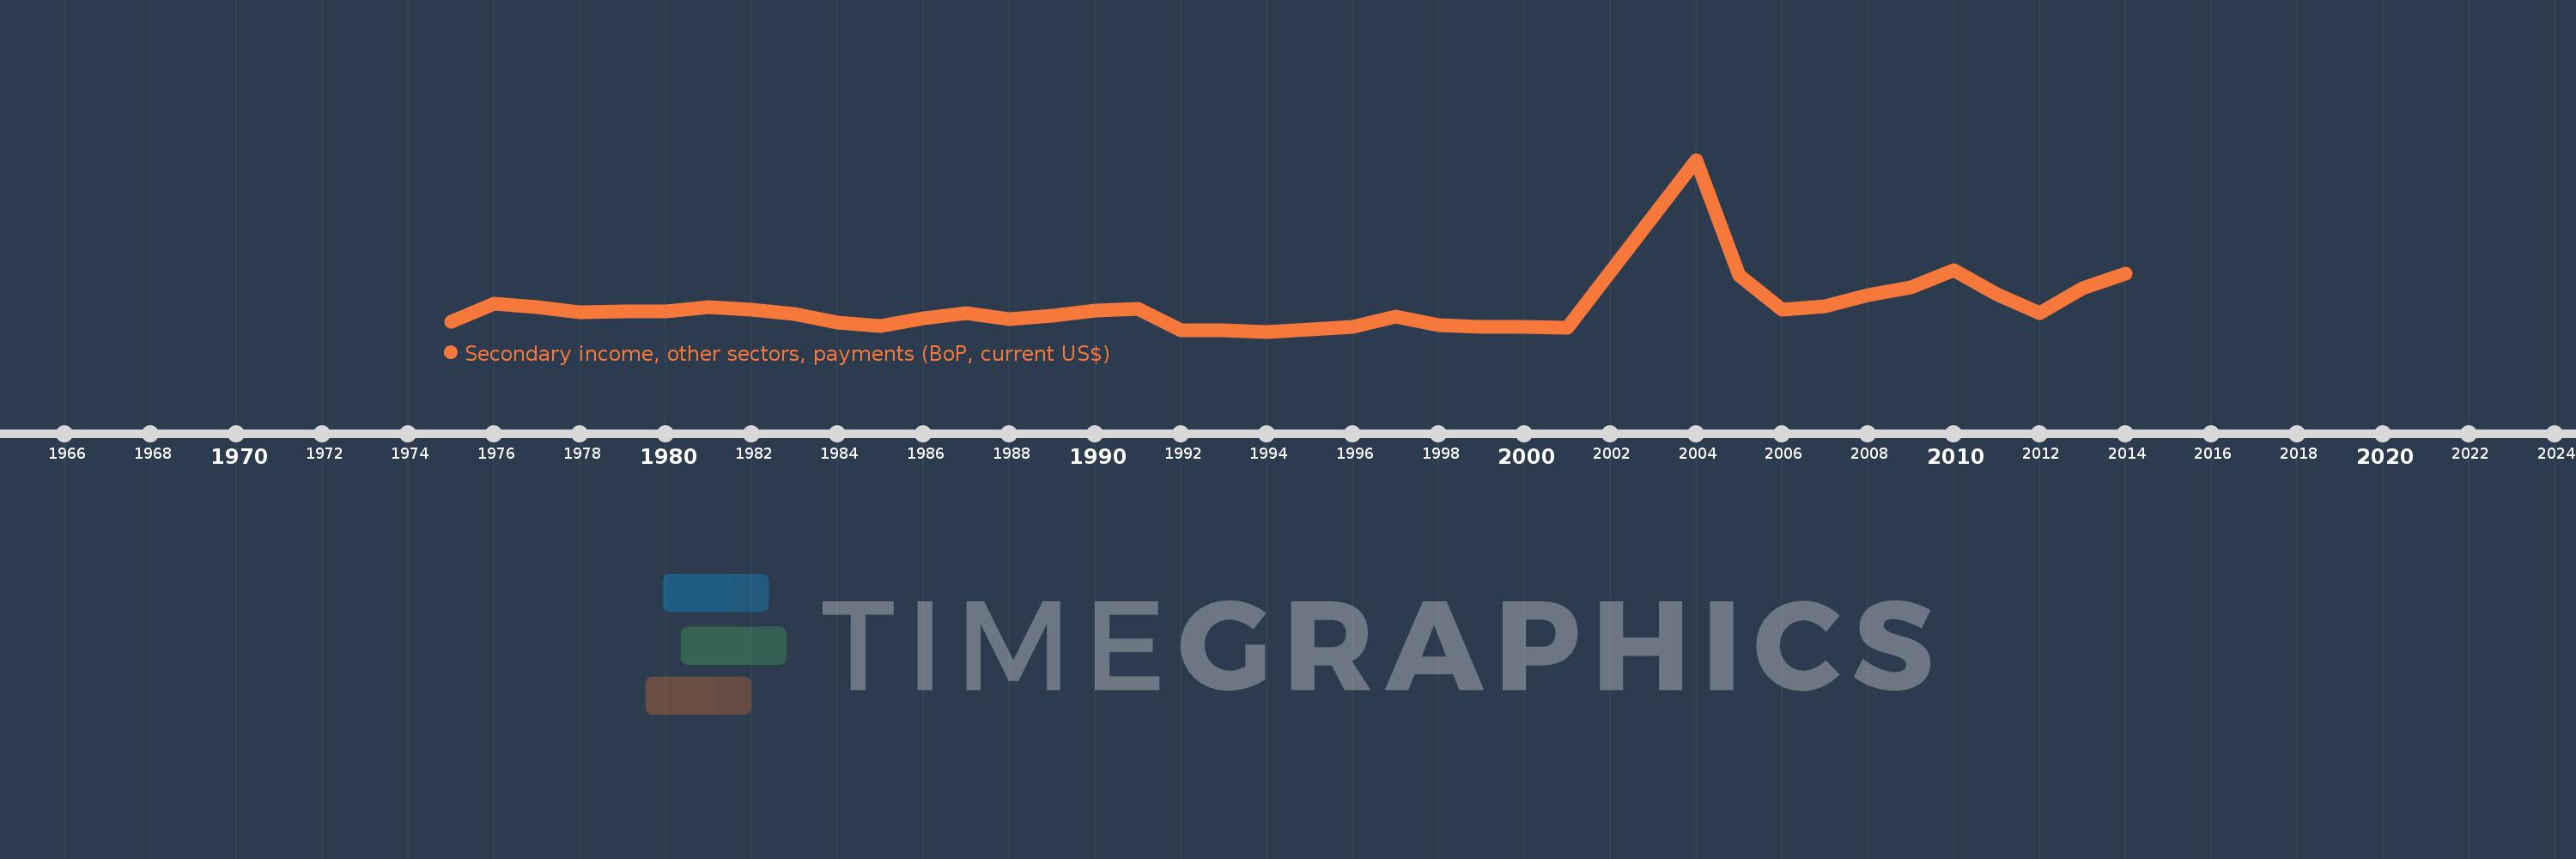
Secondary income, other sectors, payments (BoP, current US$)
2014,2013,2012,2011,2010,2009,2008,2007,2006,2005,2004,2001,2000,1999,1998,1997,1996,1995,1994,1993,1992,1991,1990,1989,1988,1987,1986,1985,1984,1983,1982,1981,1980,1979,1978,1977,1976,1975
Cette statistique dans les autres pays:
AfghanistanAlbaniaAlgeriaAngolaAntigua and BarbudaArab WorldArgentinaArmeniaArubaAustraliaAustriaAzerbaijanBahamas, TheBahrainBangladeshBarbadosBelarusBelgiumBelizeBeninBermudaBhutanBoliviaBosnia and HerzegovinaBotswanaBrazilBrunei DarussalamBulgariaBurkina FasoBurundiCabo VerdeCambodiaCameroonCanadaCaribbean small statesCentral African RepublicCentral Europe and the BalticsChadChileChinaColombiaComorosCongo, Dem. Rep.Congo, Rep.Costa RicaCote d'IvoireCroatiaCuracaoCyprusCzech RepublicDenmarkDjiboutiDominicaDominican RepublicEarly-demographic dividendEast Asia & PacificEast Asia & Pacific (excluding high income)East Asia & Pacific (IDA & IBRD countries)EcuadorEgypt, Arab Rep.El SalvadorEquatorial GuineaEritreaEstoniaEthiopiaEuro areaEurope & Central AsiaEurope & Central Asia (excluding high income)Europe & Central Asia (IDA & IBRD countries)European UnionFaroe IslandsFijiFinlandFragile and conflict affected situationsFranceFrench PolynesiaGabonGambia, TheGeorgiaGermanyGhanaGreeceGrenadaGuatemalaGuineaGuinea-BissauGuyanaHaitiHeavily indebted poor countries (HIPC)High incomeHondurasHong Kong SAR, ChinaHungaryIBRD onlyIcelandIDA & IBRD totalIDA blendIDA onlyIDA totalIndiaIndonesiaIran, Islamic Rep.IraqIrelandIsraelItalyJamaicaJapanJordanKazakhstanKenyaKiribatiKorea, Rep.KosovoKuwaitKyrgyz RepublicLao PDRLate-demographic dividendLatin America & Caribbean Latin America & Caribbean (excluding high income)Latin America & the Caribbean (IDA & IBRD countries)LatviaLeast developed countries: UN classificationLebanonLesothoLiberiaLibyaLithuaniaLow & middle incomeLow incomeLower middle incomeLuxembourgMacao SAR, ChinaMacedonia, FYRMadagascarMalawiMalaysiaMaldivesMaliMaltaMarshall IslandsMauritaniaMauritiusMexicoMicronesia, Fed. Sts.Middle East & North AfricaMiddle East & North Africa (excluding high income)Middle East & North Africa (IDA & IBRD countries)Middle incomeMoldovaMongoliaMontenegroMoroccoMozambiqueMyanmarNamibiaNepalNetherlandsNew CaledoniaNew ZealandNicaraguaNigerNigeriaNorth AmericaNorwayOECD membersOmanOther small statesPacific island small statesPakistanPalauPanamaPapua New GuineaParaguayPhilippinesPolandPortugalPost-demographic dividendPre-demographic dividendQatarRomaniaRussian FederationRwandaSamoaSao Tome and PrincipeSaudi ArabiaSenegalSerbiaSeychellesSierra LeoneSingaporeSint Maarten (Dutch part)Slovak RepublicSloveniaSmall statesSolomon IslandsSouth AfricaSouth AsiaSouth Asia (IDA & IBRD)South SudanSpainSri LankaSt. Kitts and NevisSt. LuciaSt. Vincent and the GrenadinesSub-Saharan Africa Sub-Saharan Africa (excluding high income)Sub-Saharan Africa (IDA & IBRD countries)SudanSurinameSwazilandSwedenSwitzerlandSyrian Arab RepublicTajikistanTanzaniaThailandTimor-LesteTogoTongaTrinidad and TobagoTunisiaTurkeyTuvaluUgandaUkraineUnited KingdomUnited StatesUpper middle incomeUruguayVanuatuVenezuela, RBVietnamWest Bank and GazaWorldYemen, Rep.ZambiaZimbabwe La ligne de temps
Cette échelle de temps montre un graphique de 1975 année à 2014 année Madagascar. Les données jusqu'à 1974 année ne sont pas présentés. Quantité d'observations actuelles selon dates: 38.
Source (désignation):
Les indicateurs du développement mondiale
Source (organisation):
International Monetary Fund, Balance of Payments Statistics Yearbook and data files.
Catégories:
Economy & Growth
Dernière mise à jour
23 avr. 2017
Les indicateurs de changement de valeurs selon les années
Minimum:
6.422 mln.
1 janv. 1994
Maximum:
178.19 mln.
1 janv. 2004
Pour la date d''observation
Valeur
Changement absolu
Le changement par rapport à la valeur précédente
1 janv. 1975
16.41 mln.
+16.41 mln.
0.0%
1 janv. 1976
34.482 mln.
+18.072 mln.
110.13%
1 janv. 1977
30.634 mln.
-3.848 mln.
-11.16%
1 janv. 1978
25.521 mln.
-5.113 mln.
-16.69%
1 janv. 1979
26.944 mln.
+1.423 mln.
5.57%
1 janv. 1980
26.749 mln.
-195.113 milles
-0.72%
1 janv. 1981
31.238 mln.
+4.49 mln.
16.78%
1 janv. 1982
28.042 mln.
-3.196 mln.
-10.23%
1 janv. 1983
24.19 mln.
-3.853 mln.
-13.74%
1 janv. 1984
15.193 mln.
-8.996 mln.
-37.19%
1 janv. 1985
11.983 mln.
-3.21 mln.
-21.13%
1 janv. 1986
19.306 mln.
+7.323 mln.
61.11%
1 janv. 1987
24.633 mln.
+5.326 mln.
27.59%
1 janv. 1988
18.752 mln.
-5.88 mln.
-23.87%
1 janv. 1989
21.903 mln.
+3.151 mln.
16.8%
1 janv. 1990
27.56 mln.
+5.656 mln.
25.82%
1 janv. 1991
29.442 mln.
+1.882 mln.
6.83%
1 janv. 1992
7.938 mln.
-21.503 mln.
-73.04%
1 janv. 1993
7.323 mln.
-615.405 milles
-7.75%
1 janv. 1994
6.422 mln.
-901.255 milles
-12.31%
1 janv. 1995
8.304 mln.
+1.882 mln.
29.3%
1 janv. 1996
10.925 mln.
+2.621 mln.
31.56%
1 janv. 1997
21.777 mln.
+10.852 mln.
99.34%
1 janv. 1998
13.165 mln.
-8.612 mln.
-39.55%
1 janv. 1999
10.903 mln.
-2.261 mln.
-17.18%
1 janv. 2000
10.802 mln.
-101.024 milles
-0.93%
1 janv. 2001
10.469 mln.
-333.24 milles
-3.08%
1 janv. 2004
178.19 mln.
+167.721 mln.
1.6 milles%
1 janv. 2005
62.404 mln.
-115.787 mln.
-64.98%
1 janv. 2006
28.327 mln.
-34.077 mln.
-54.61%
1 janv. 2007
31.645 mln.
+3.318 mln.
11.71%
1 janv. 2008
42.966 mln.
+11.322 mln.
35.78%
1 janv. 2009
50.959 mln.
+7.992 mln.
18.6%
1 janv. 2010
67.943 mln.
+16.984 mln.
33.33%
1 janv. 2011
43.778 mln.
-24.165 mln.
-35.57%
1 janv. 2012
24.73 mln.
-19.047 mln.
-43.51%
1 janv. 2013
49.705 mln.
+24.975 mln.
100.99%
1 janv. 2014
63.985 mln.
+14.28 mln.
28.73%
Classement des pays selon les statistiques actuelles par années


Commentaires: